Pose Viewer: Advanced Molecular Pose Analysis
Analyze and compare molecular poses with powerful visualization tools. Calculate interactions, explore docking results, and understand protein-ligand binding through interactive 3D analysis.
Representations
Flexible visualization and analysis tools to explore molecular poses in detail
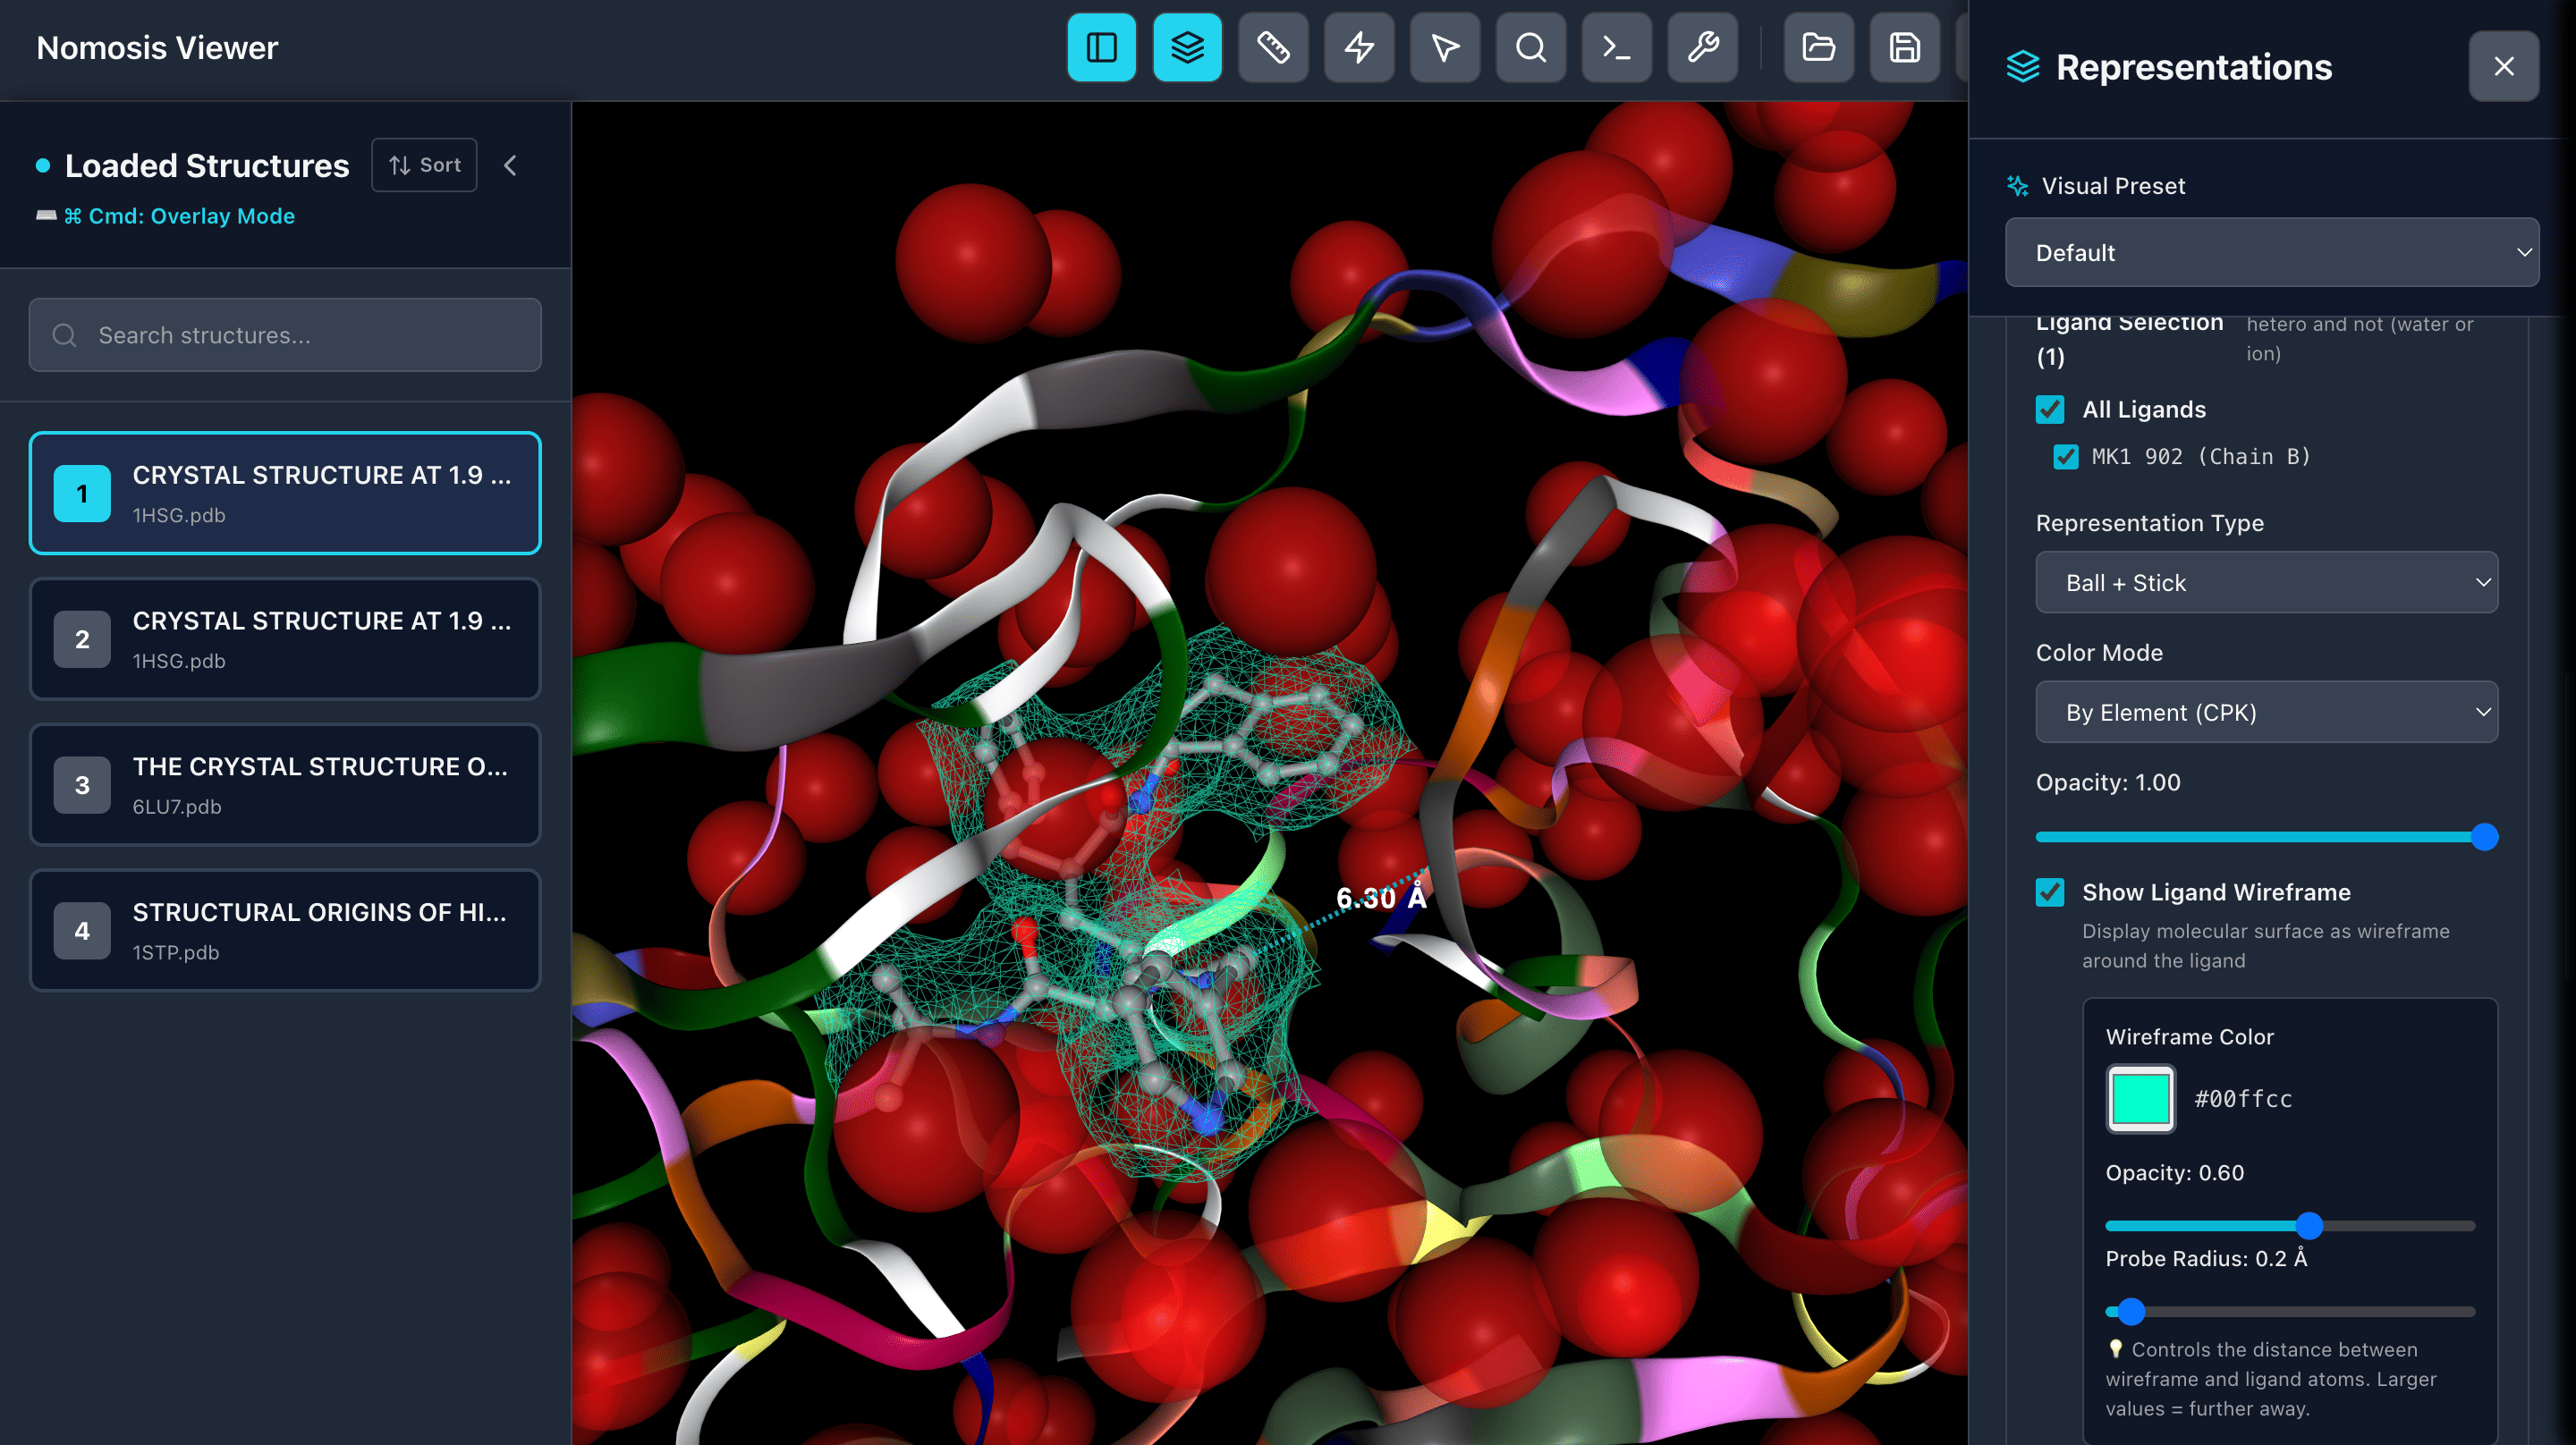
Custom Representations
Select specific elements like waters, ions, proteins, residues nearby ligand, and apply custom styles, colors, representations, and opacity to highlight key molecular features.
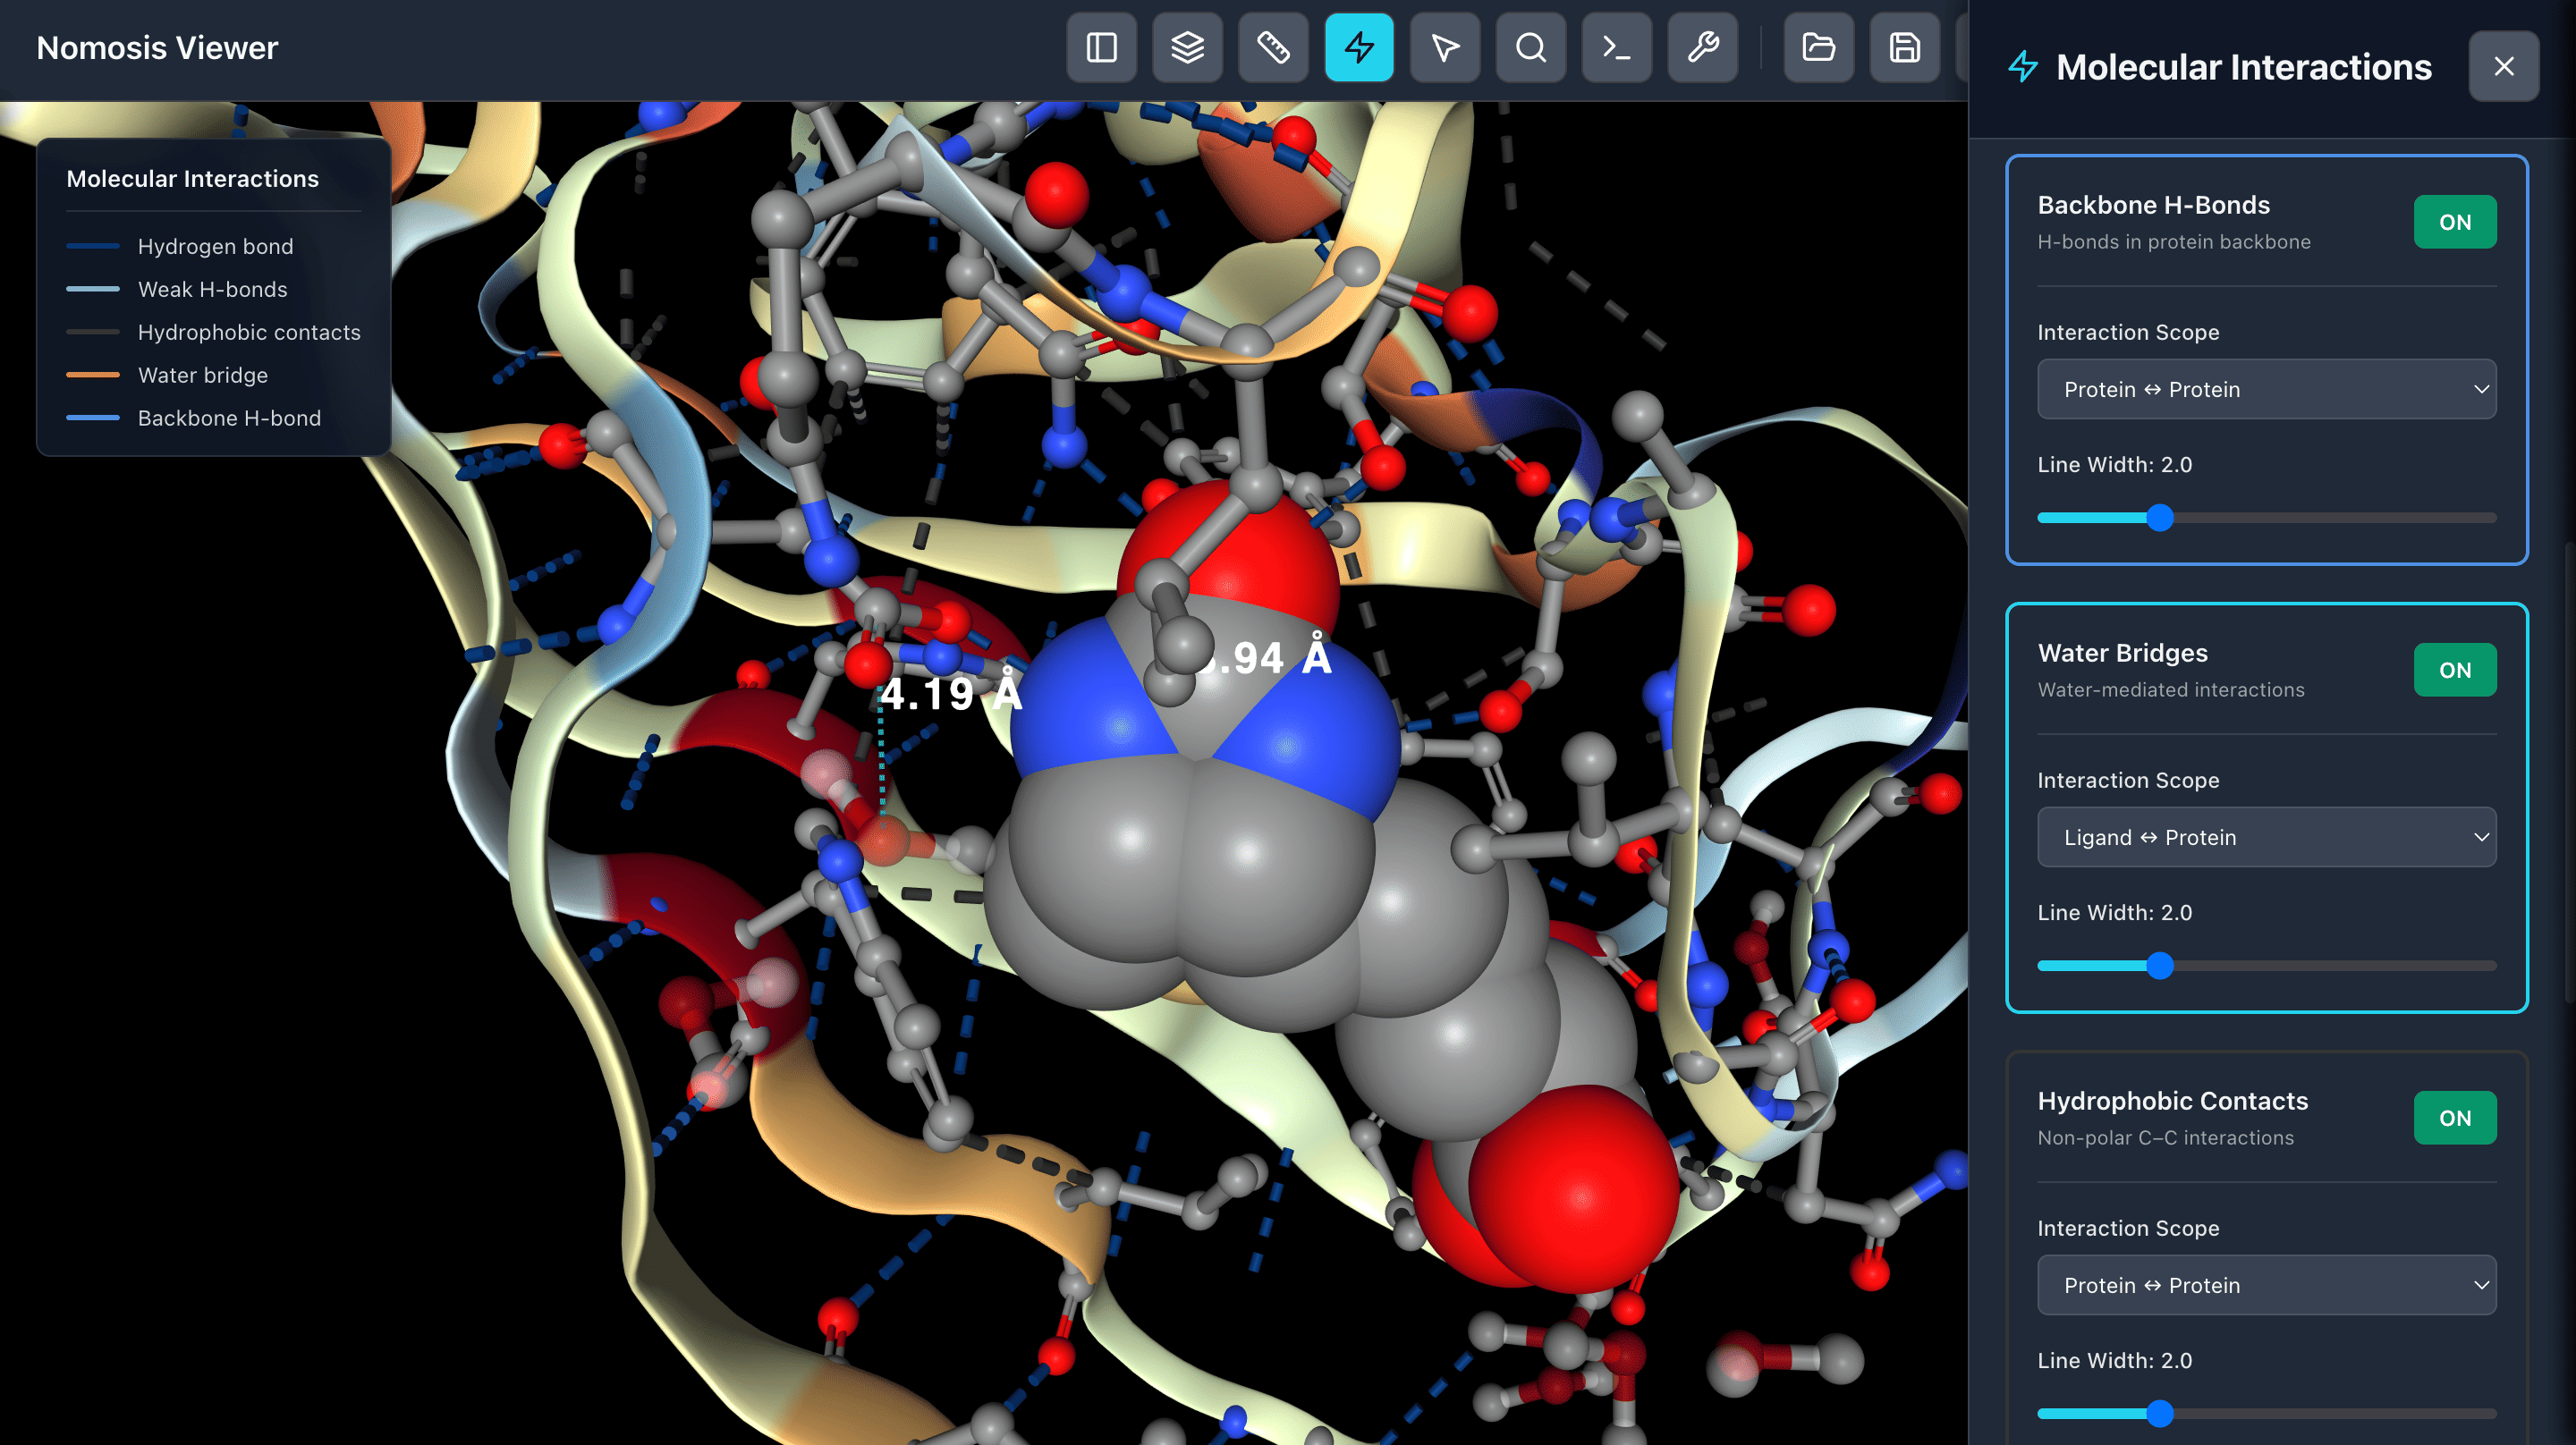
Calculate Interactions
Calculate molecular interactions between protein-ligand or protein-protein complexes including hydrogen bonds, π-π stacking, salt bridges, and other non-covalent interactions.
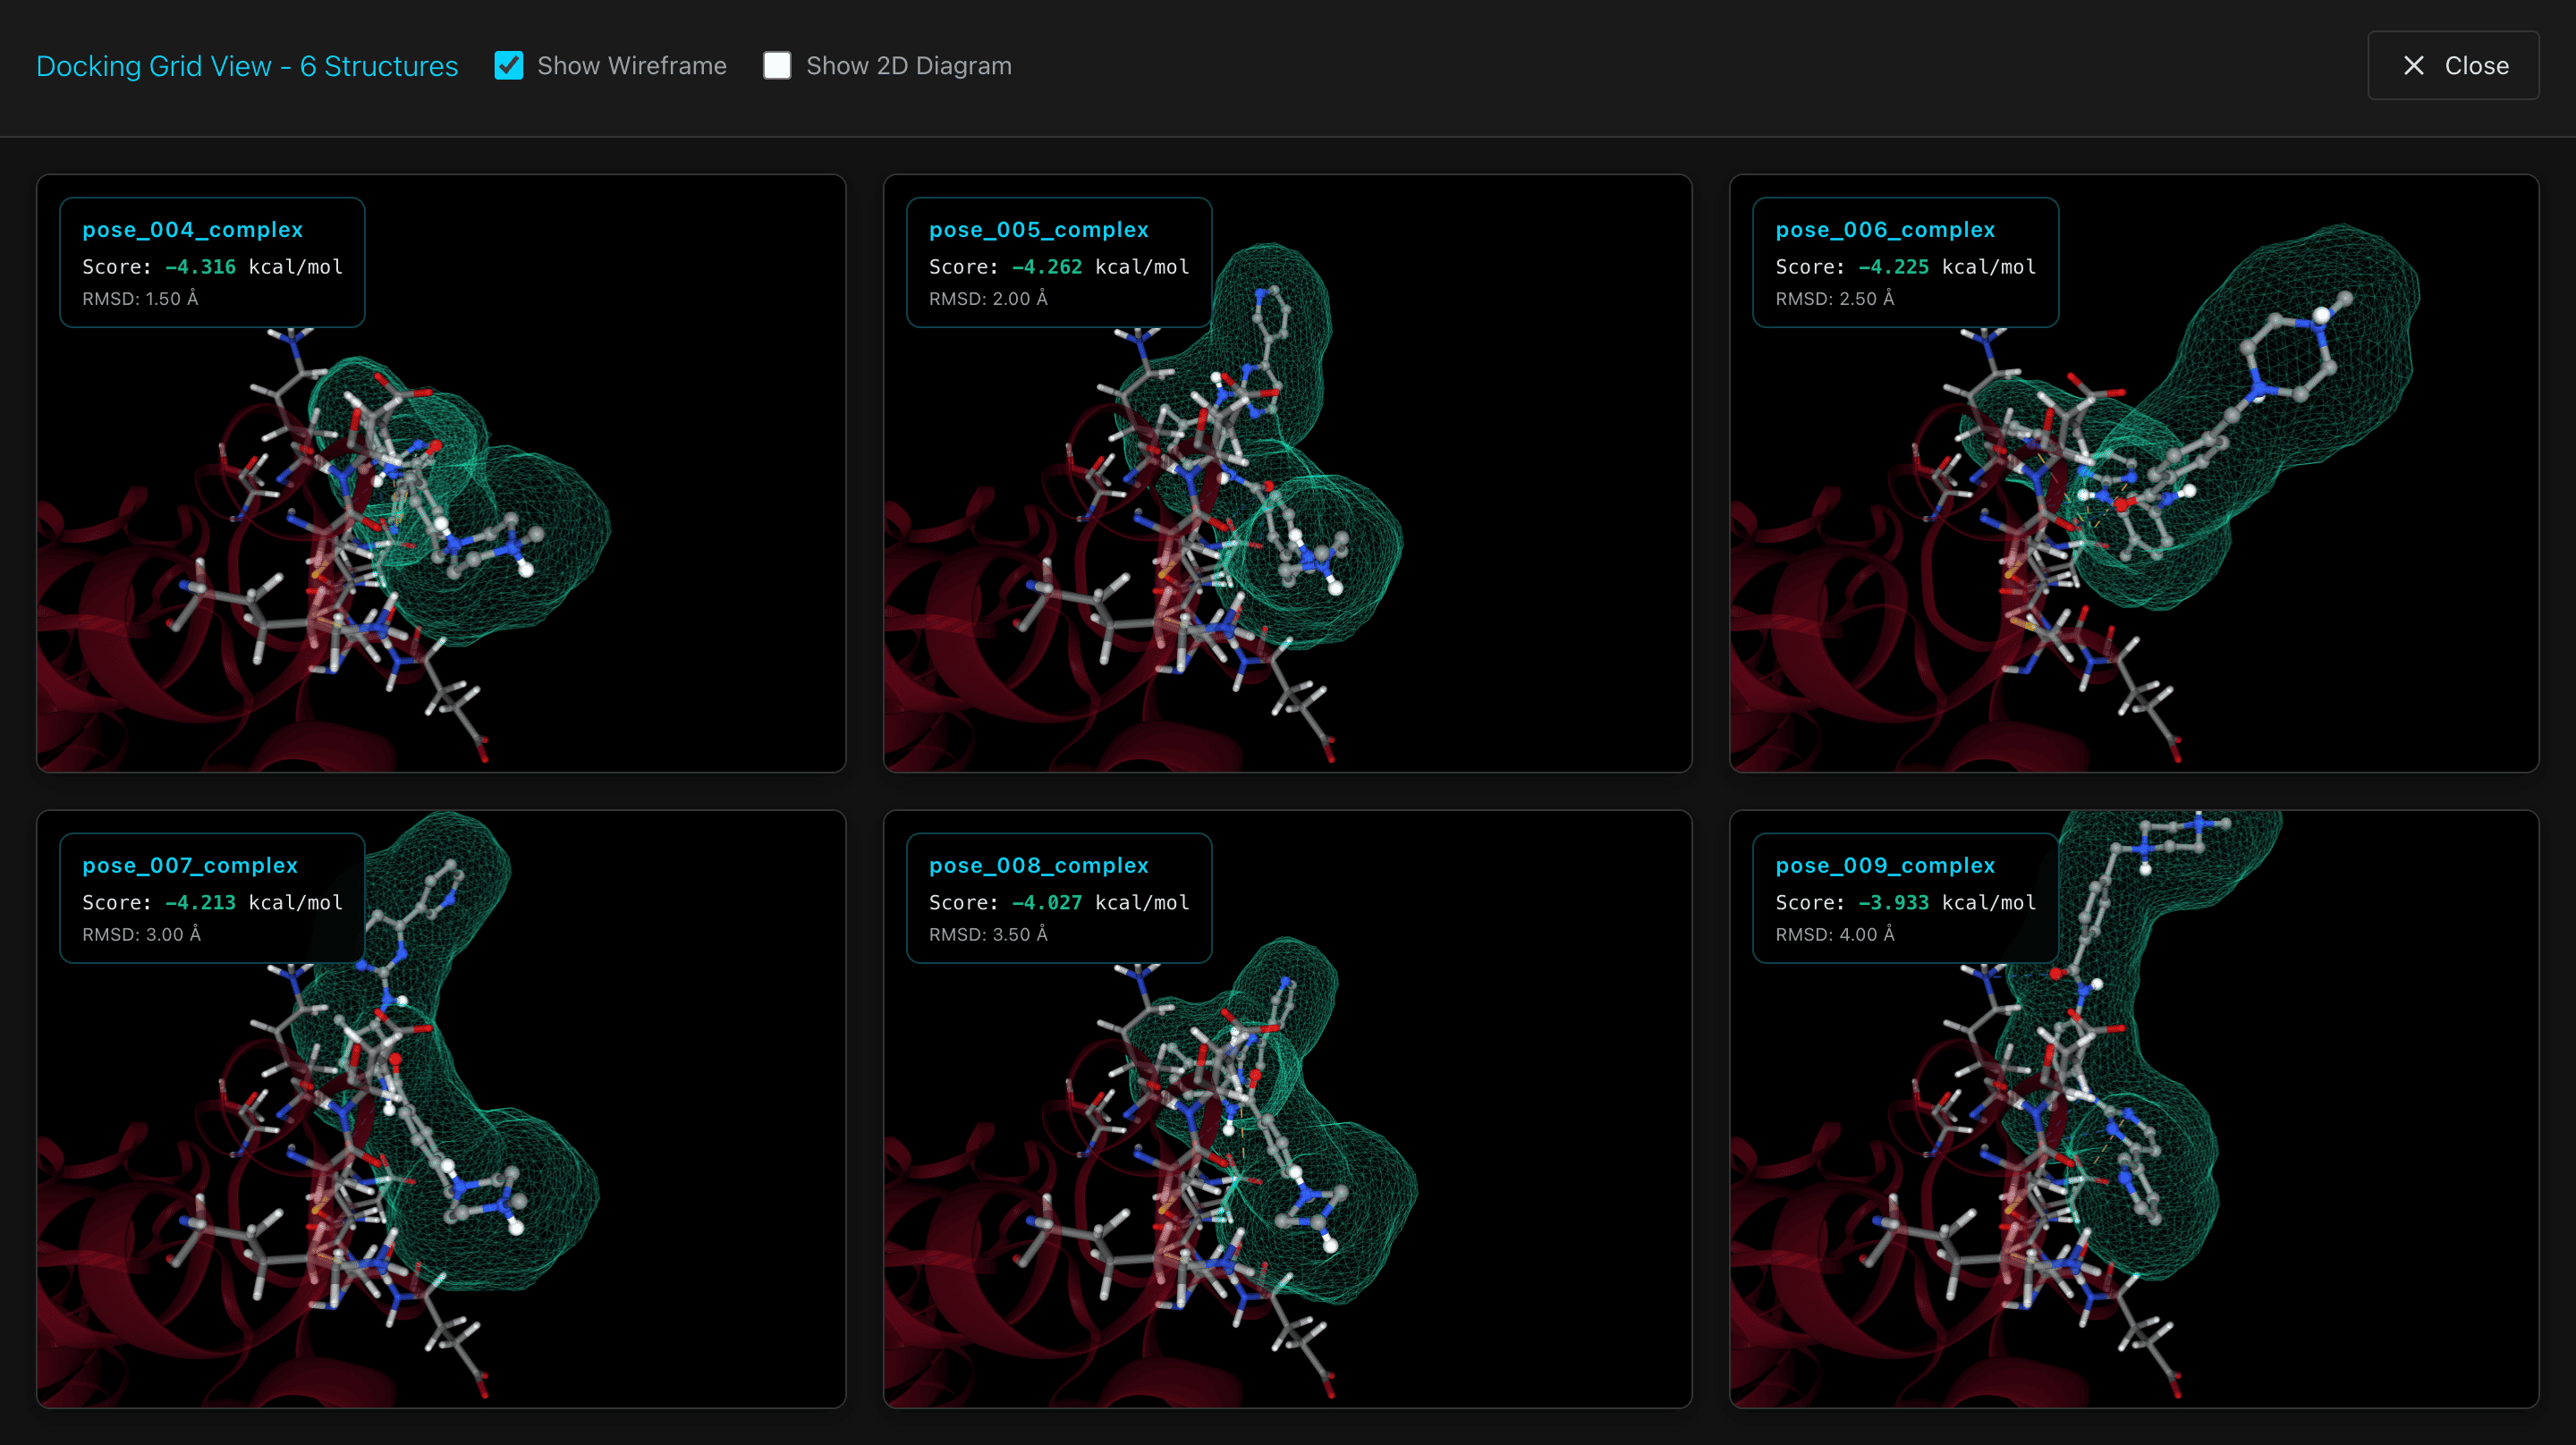
Analyze Docking
View a grid of docking poses that rotate simultaneously, allowing you to compare multiple poses side-by-side and identify the most favorable binding conformations.
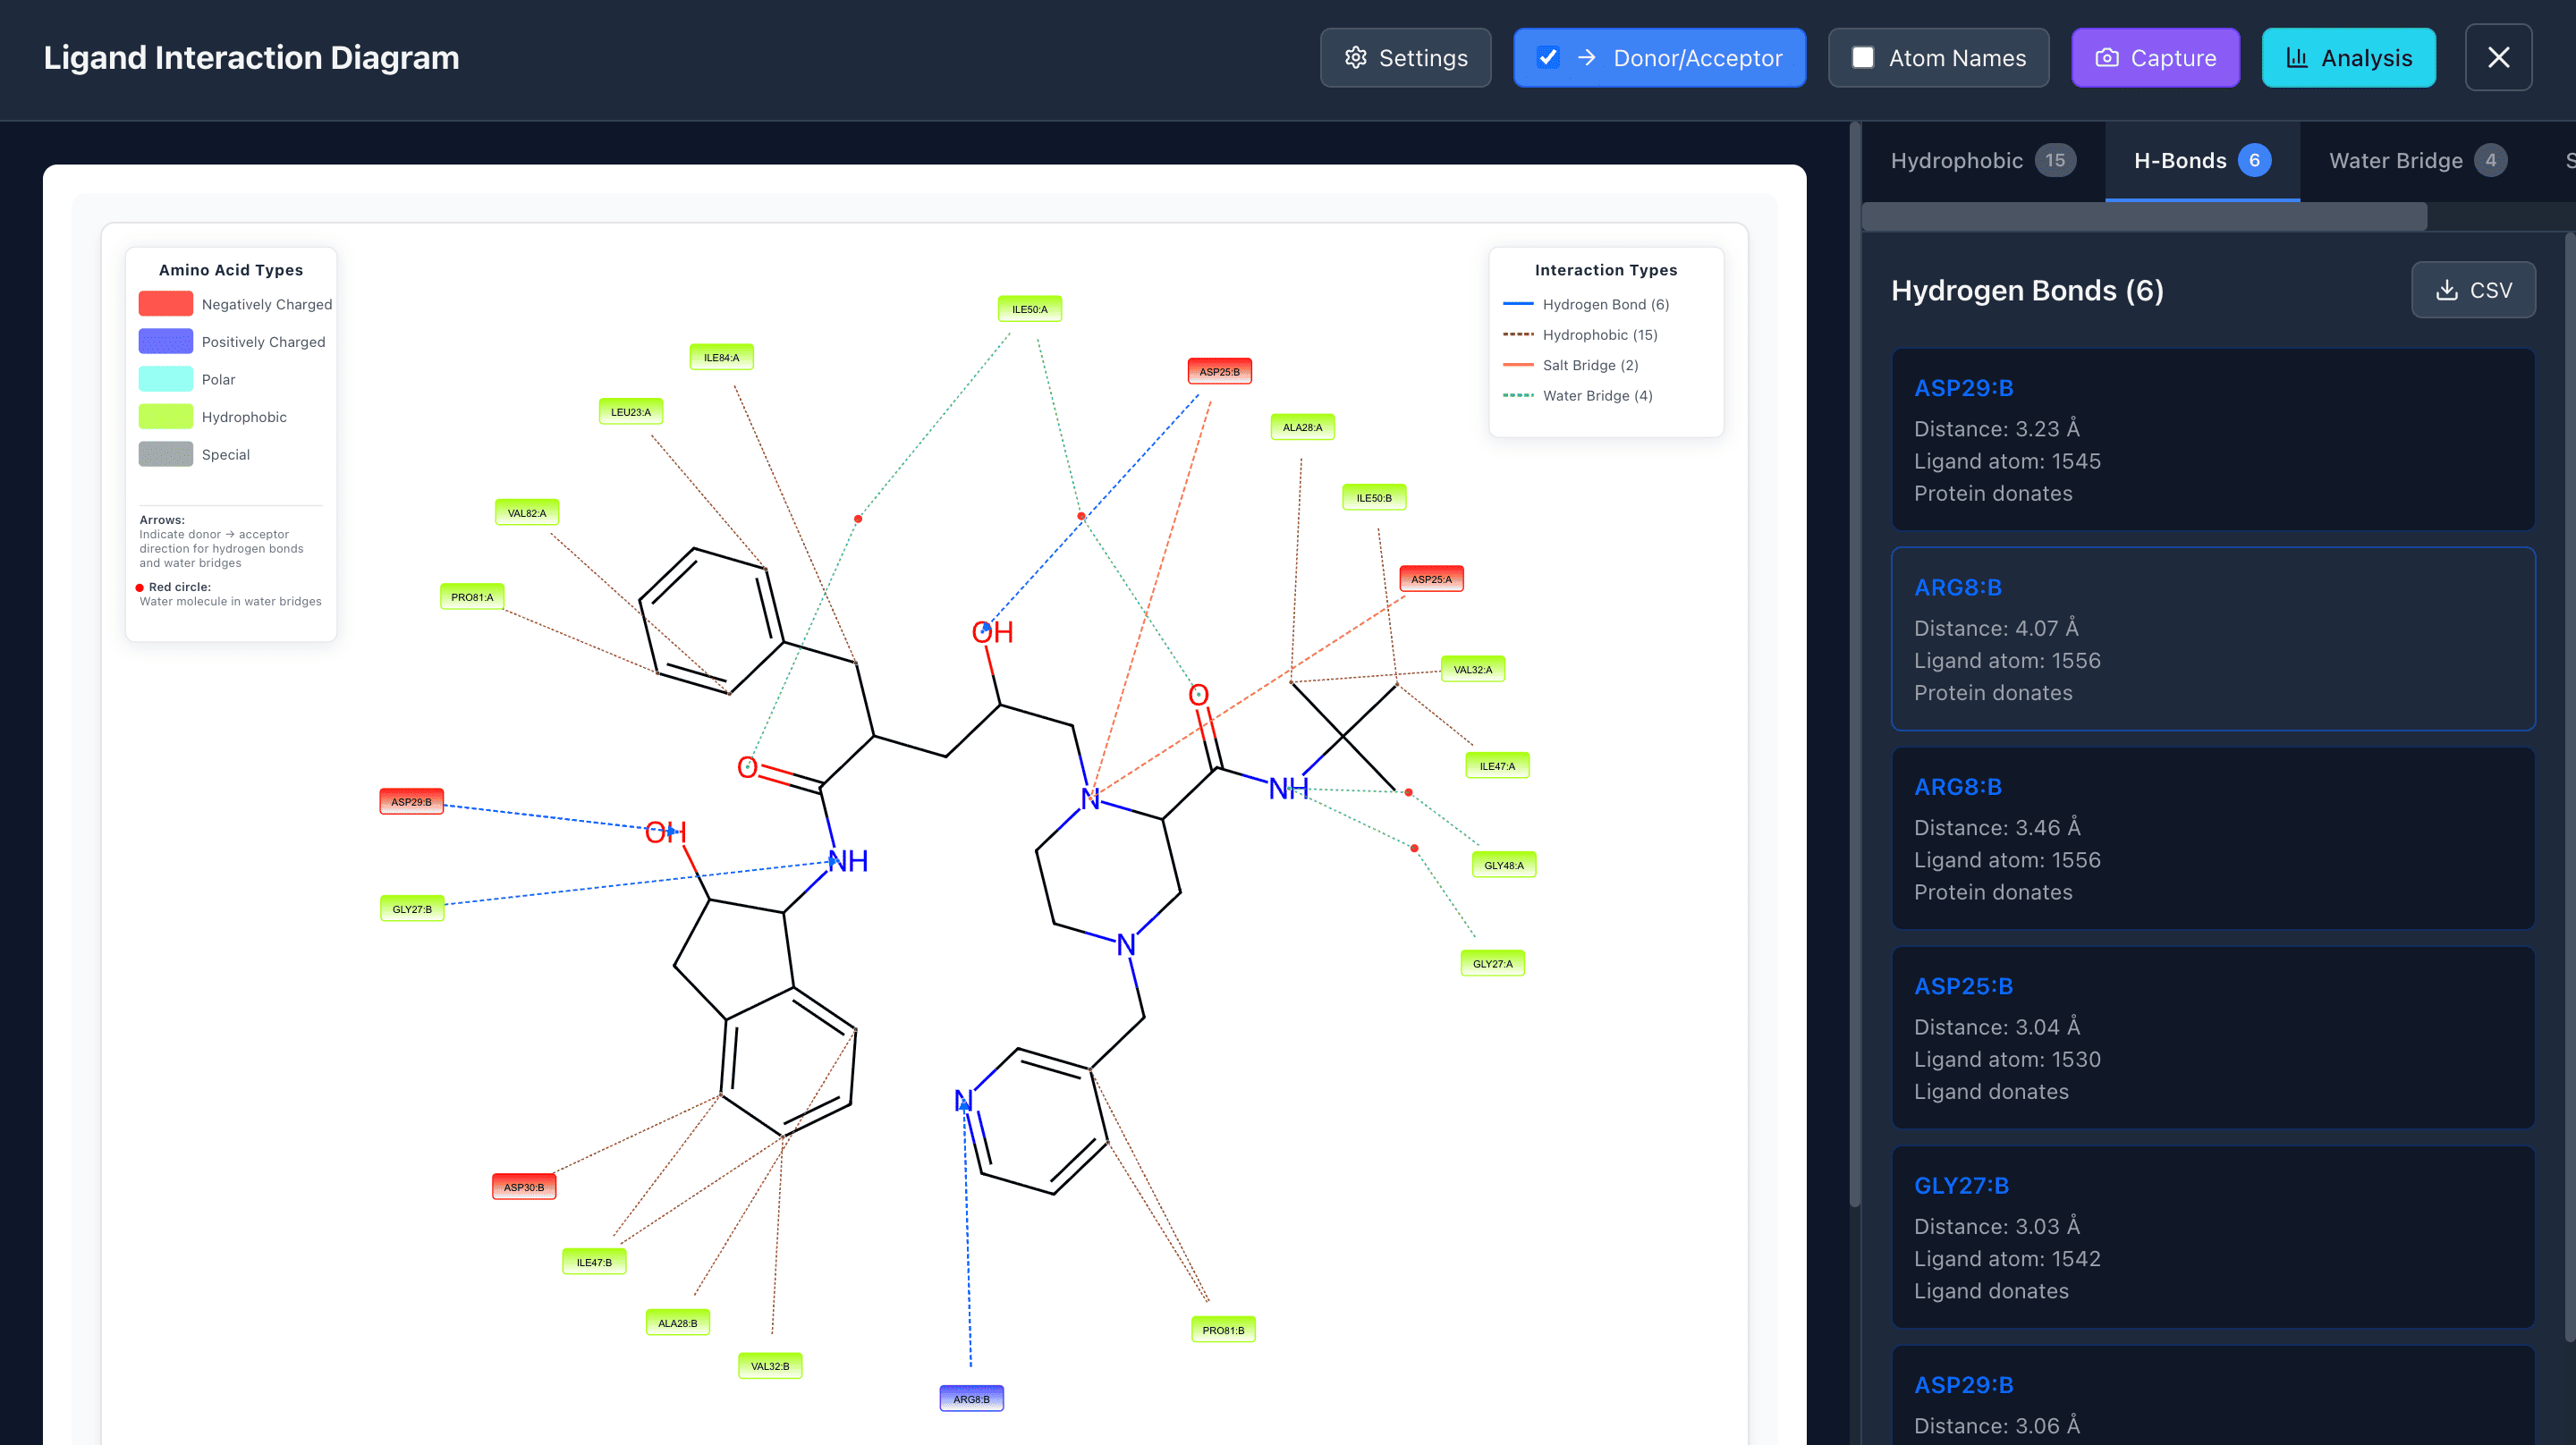
Ligand Interaction
Analyze ligand atoms that interact with the protein through various interaction types: π-π stacking, cation-π stacking, hydrophobic contacts, hydrogen bonds, salt bridges, and water bridges.
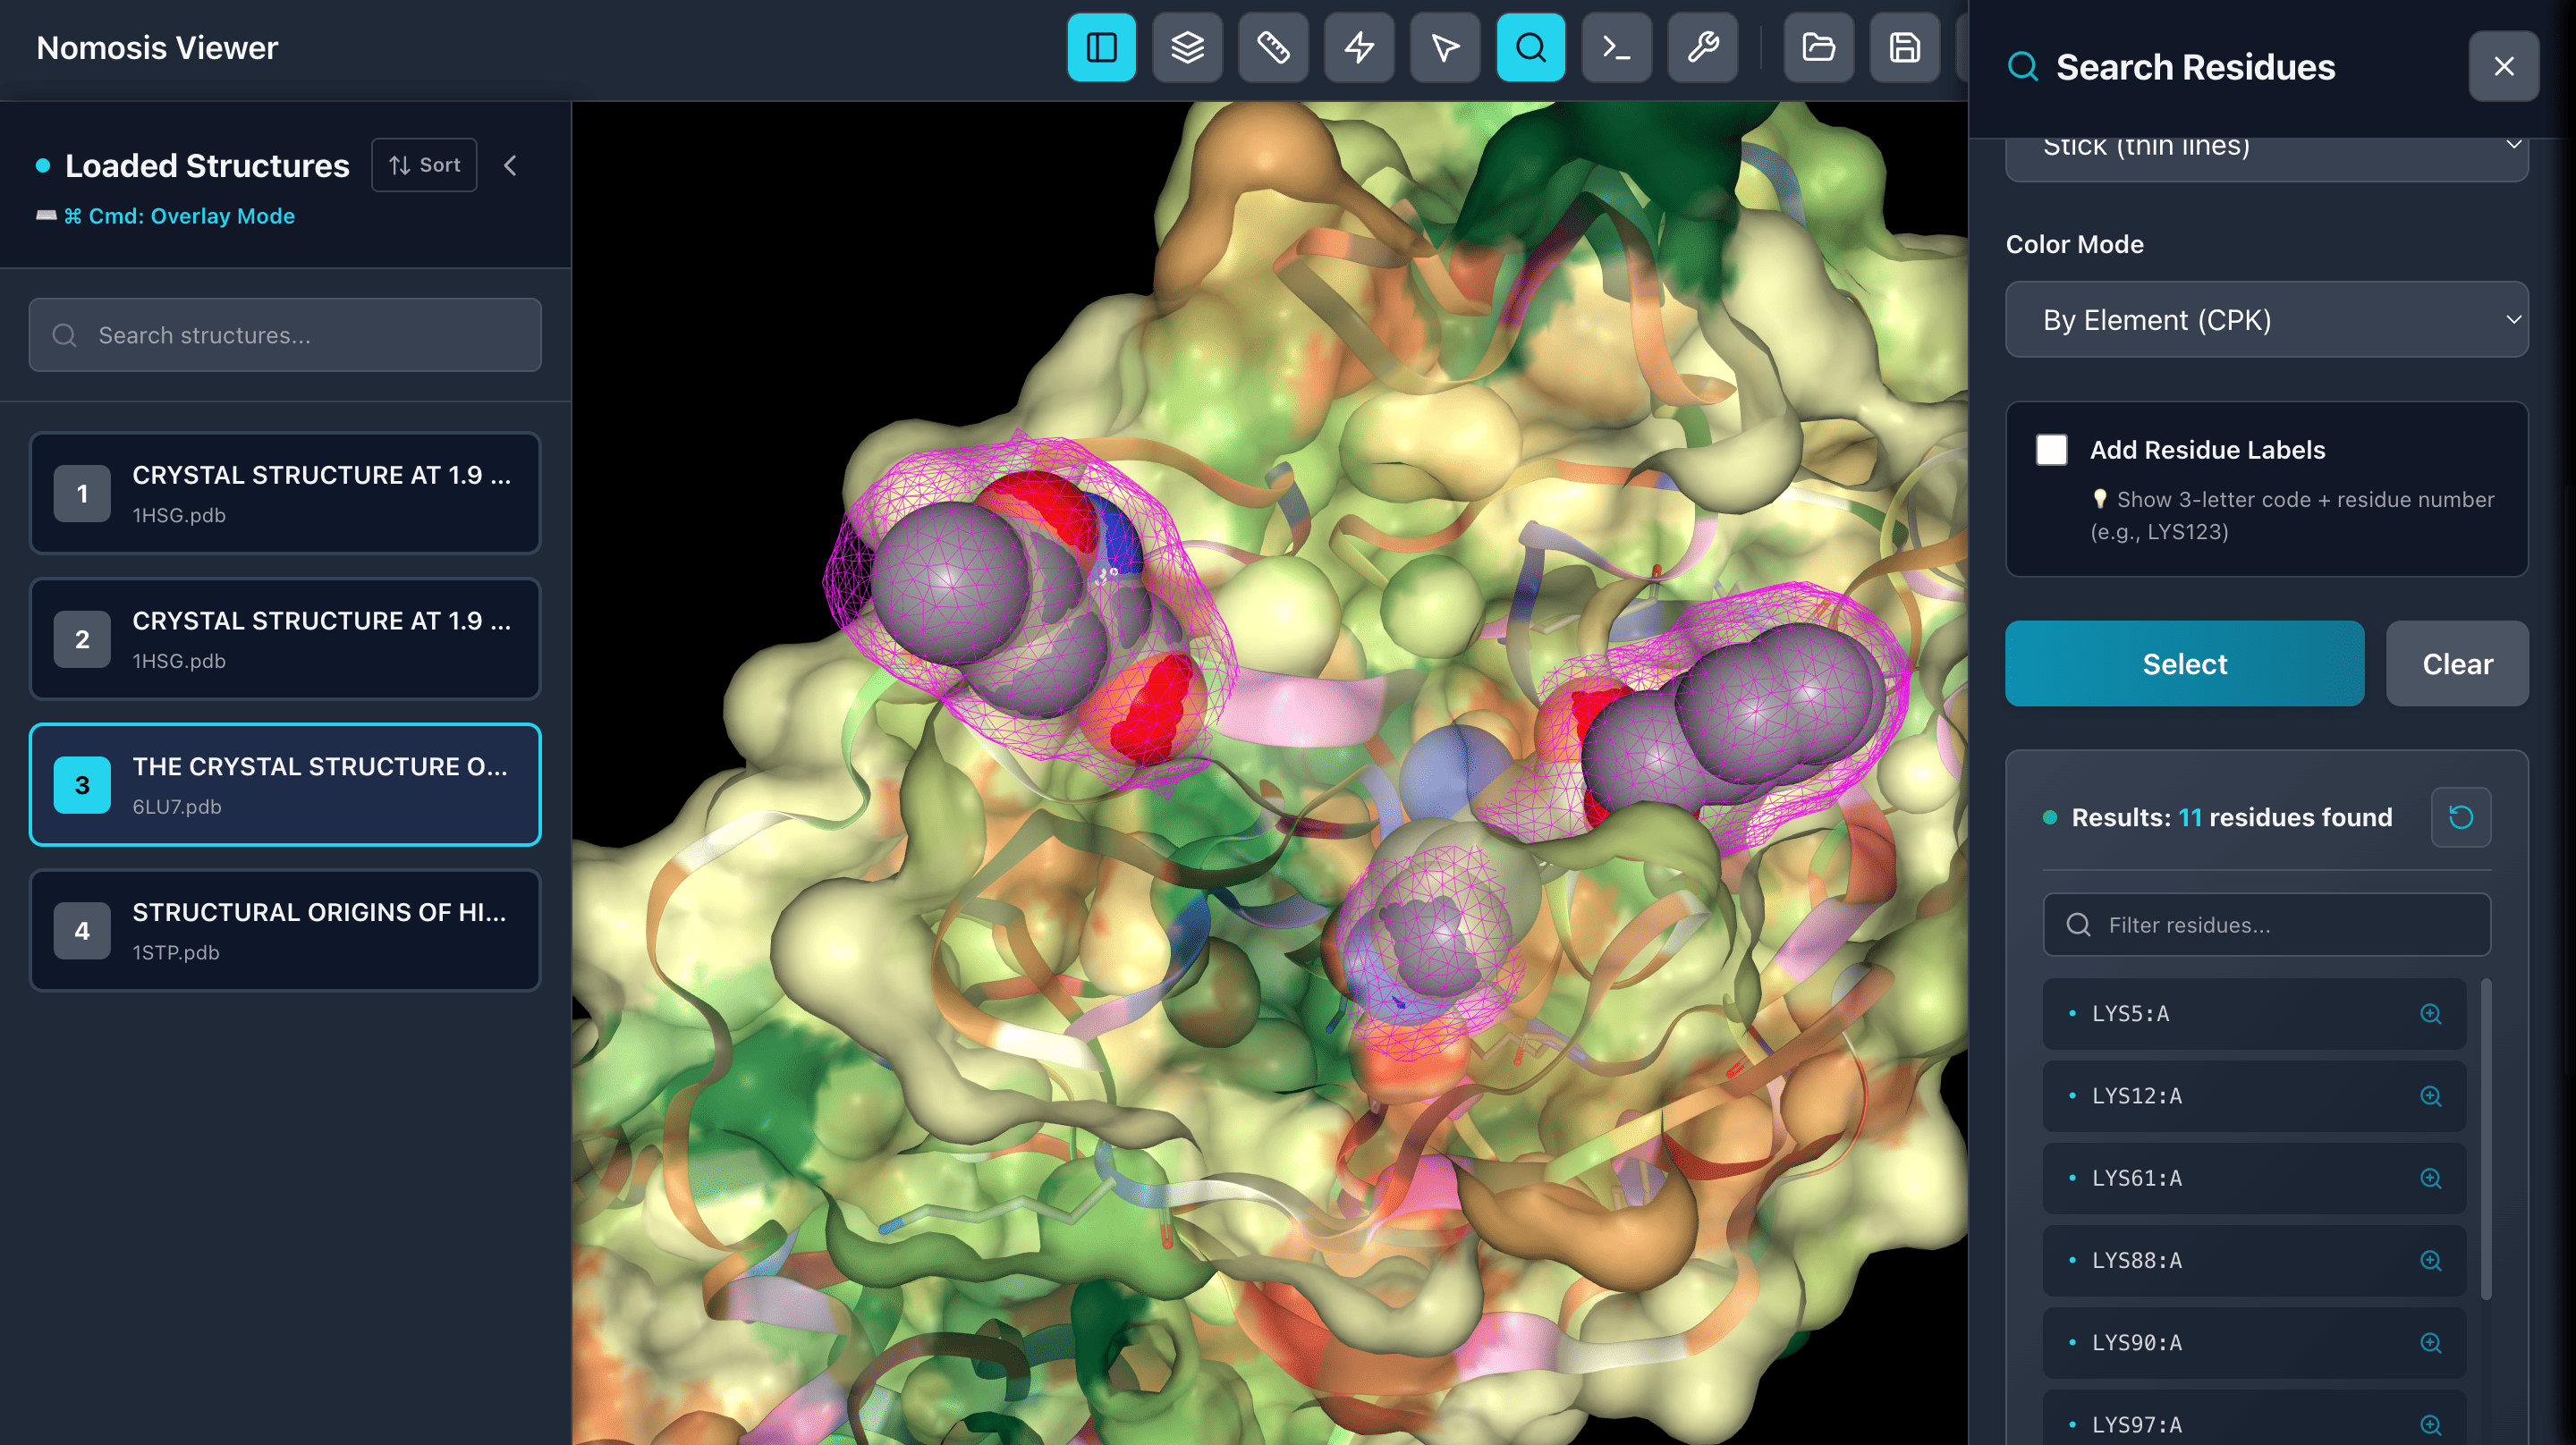
Search Residues
Select residues by name or number and view them in a table. Click on any residue to zoom in and focus on specific regions of interest in your molecular structure.
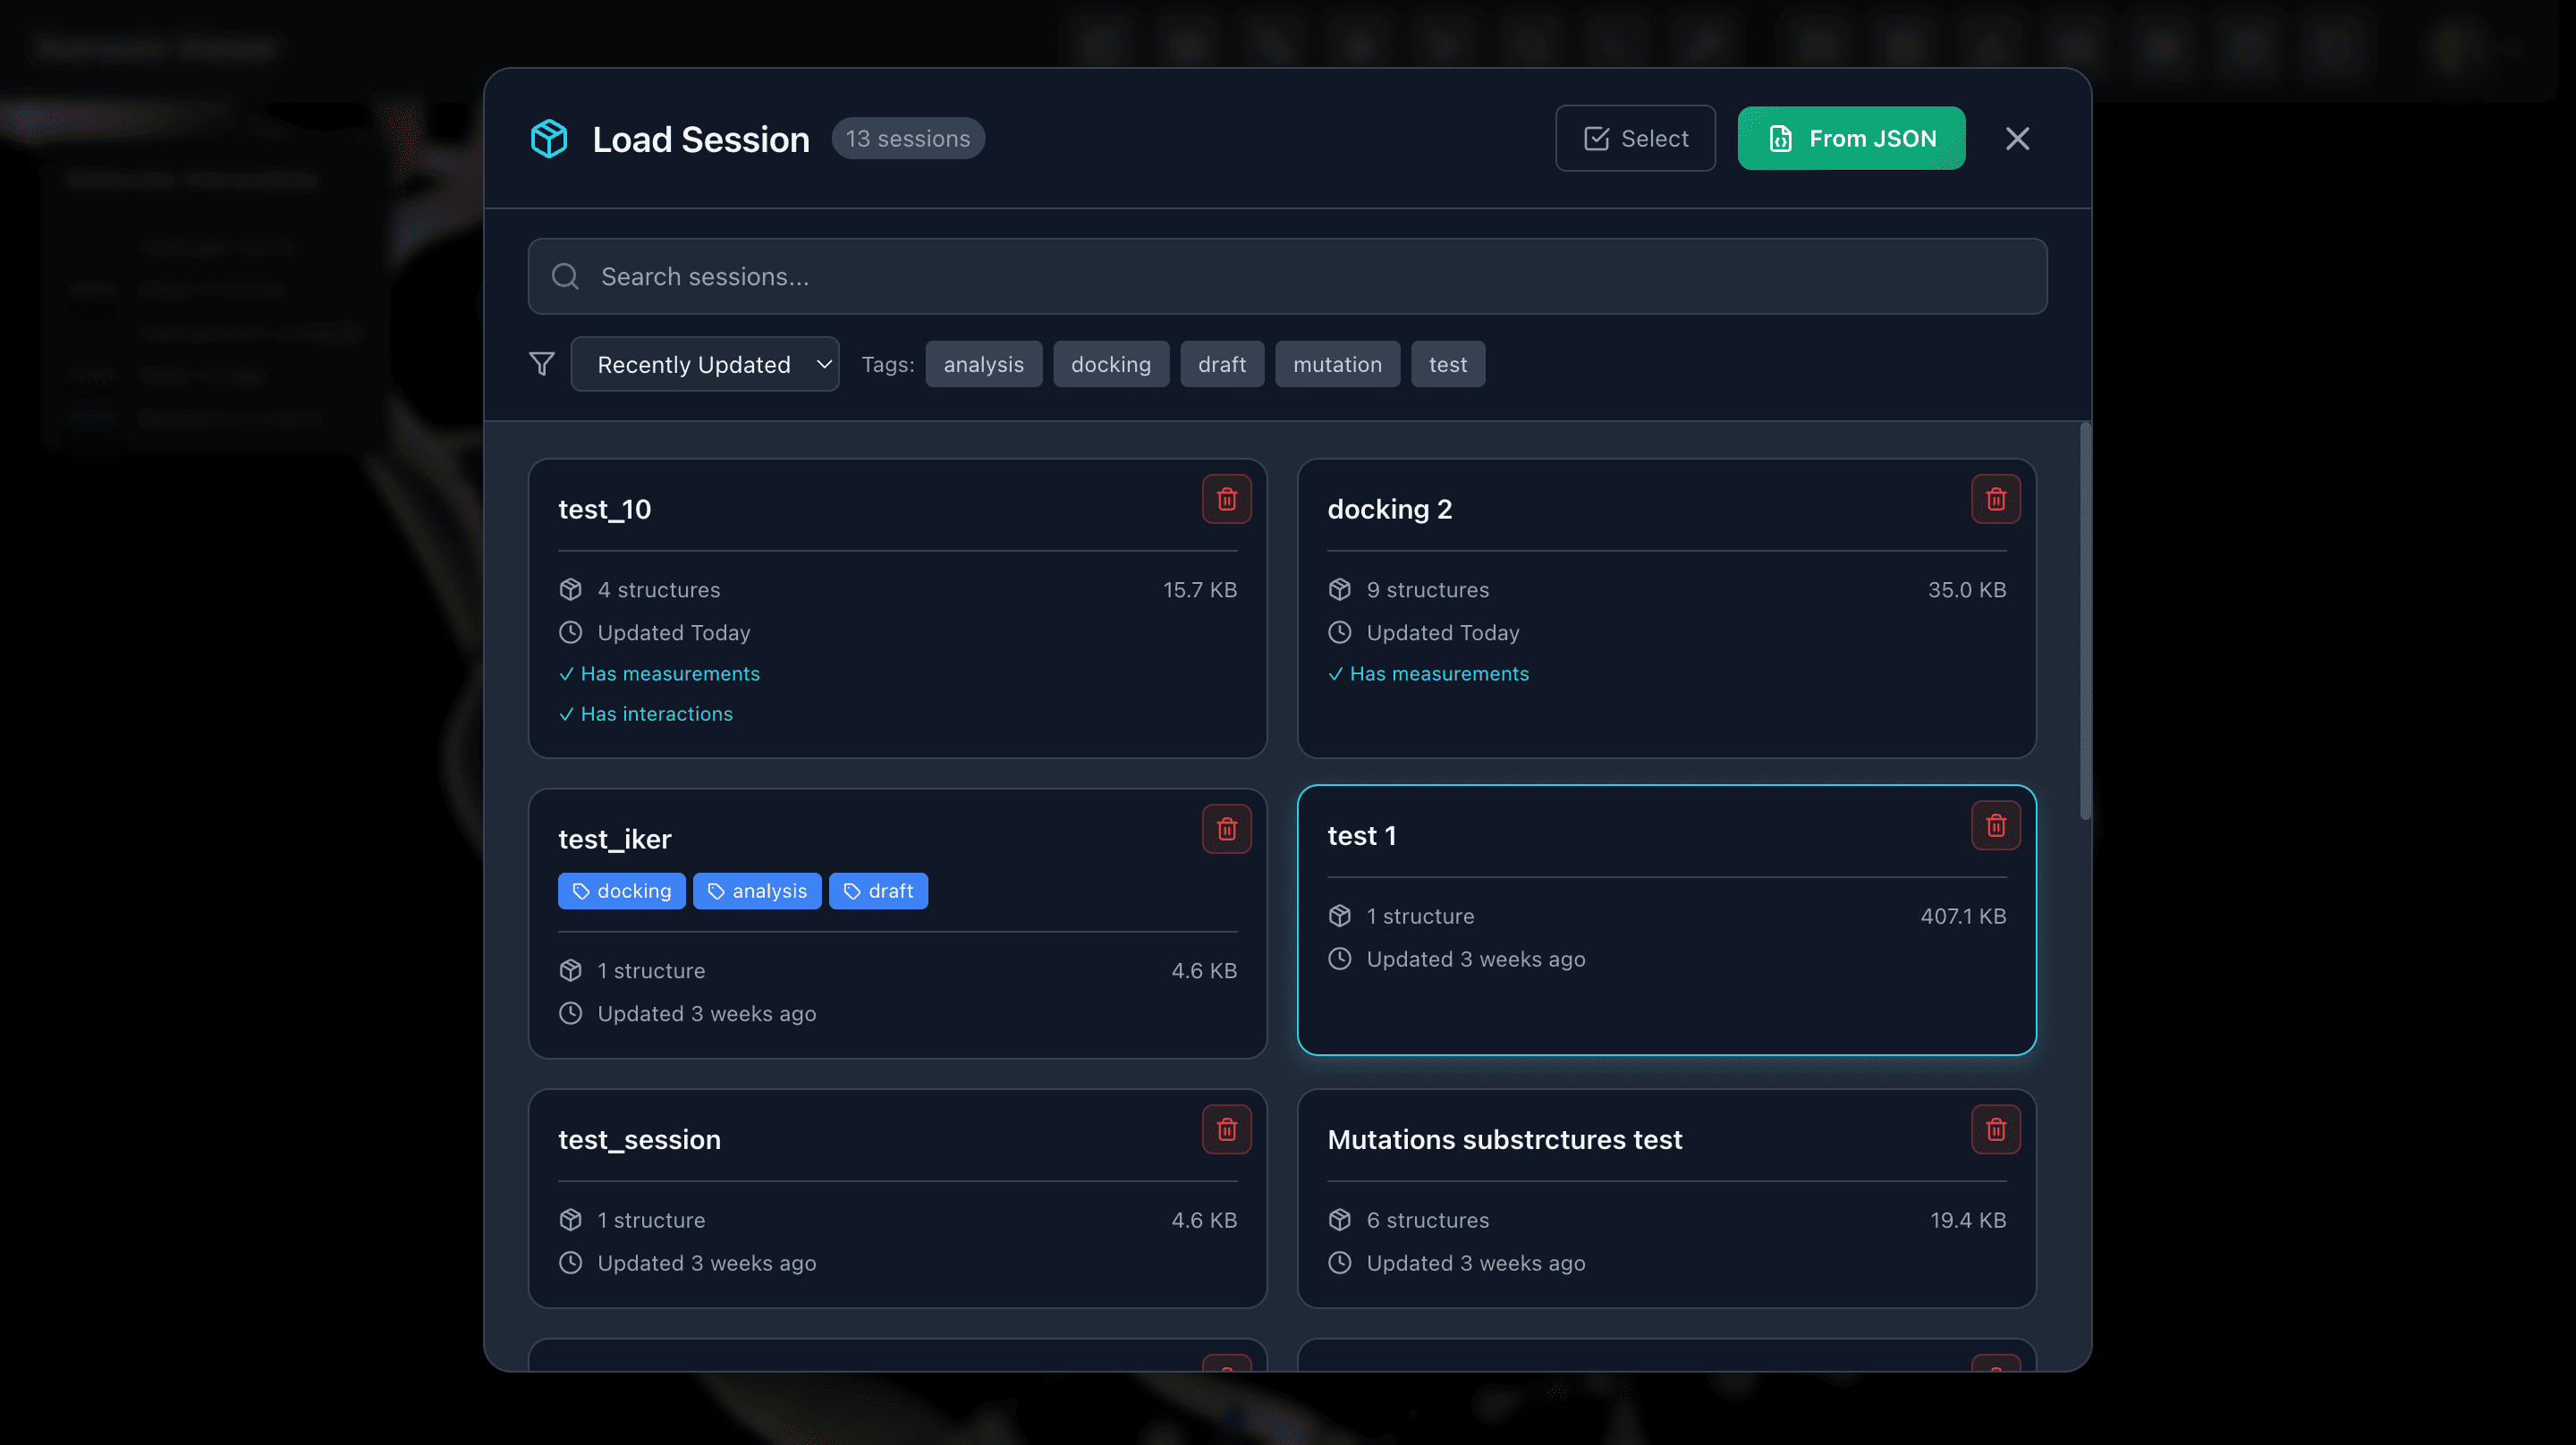
Load and Save Sessions
Save sessions with all calculation results and representation settings to revisit later. Access your saved sessions from Nomosis Notes for seamless workflow integration.
Tools
Advanced tools for molecular pose analysis and manipulation
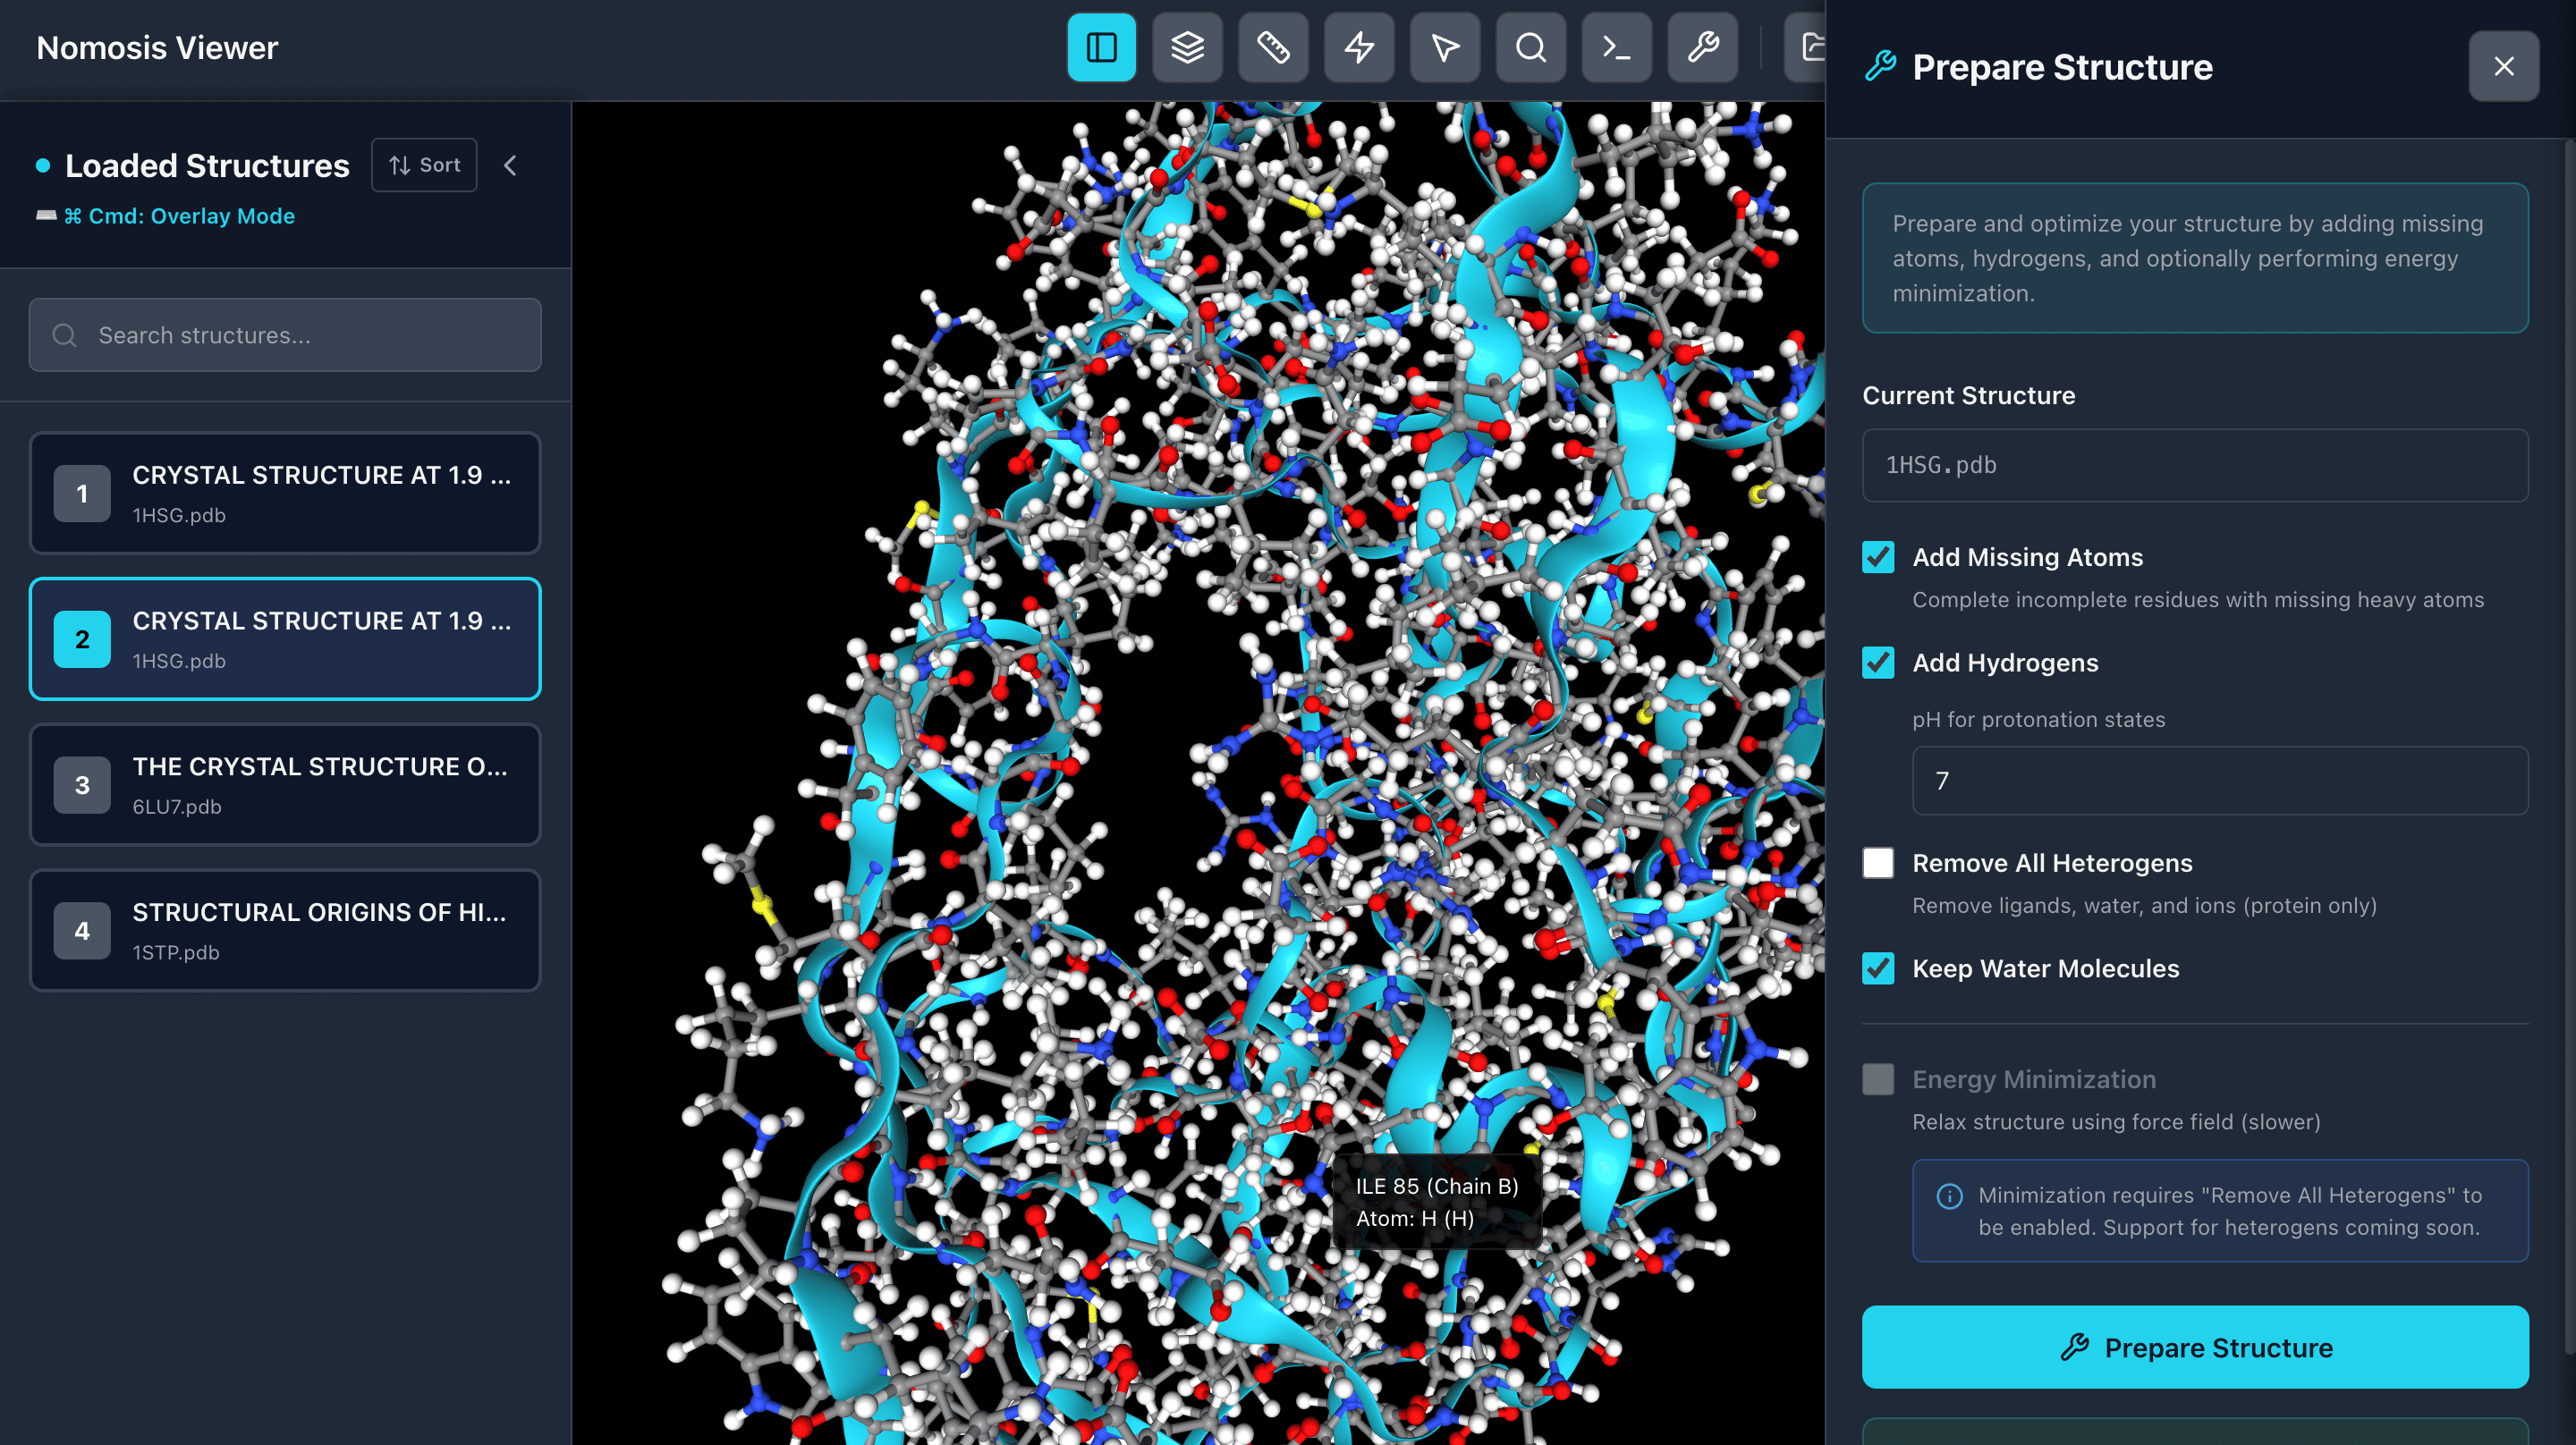
Protein Preparation
Protonate your proteins with hydrogens at a specific pH and perform energy minimization to optimize structures. Prepare clean, ready-to-use protein structures for docking and analysis workflows.
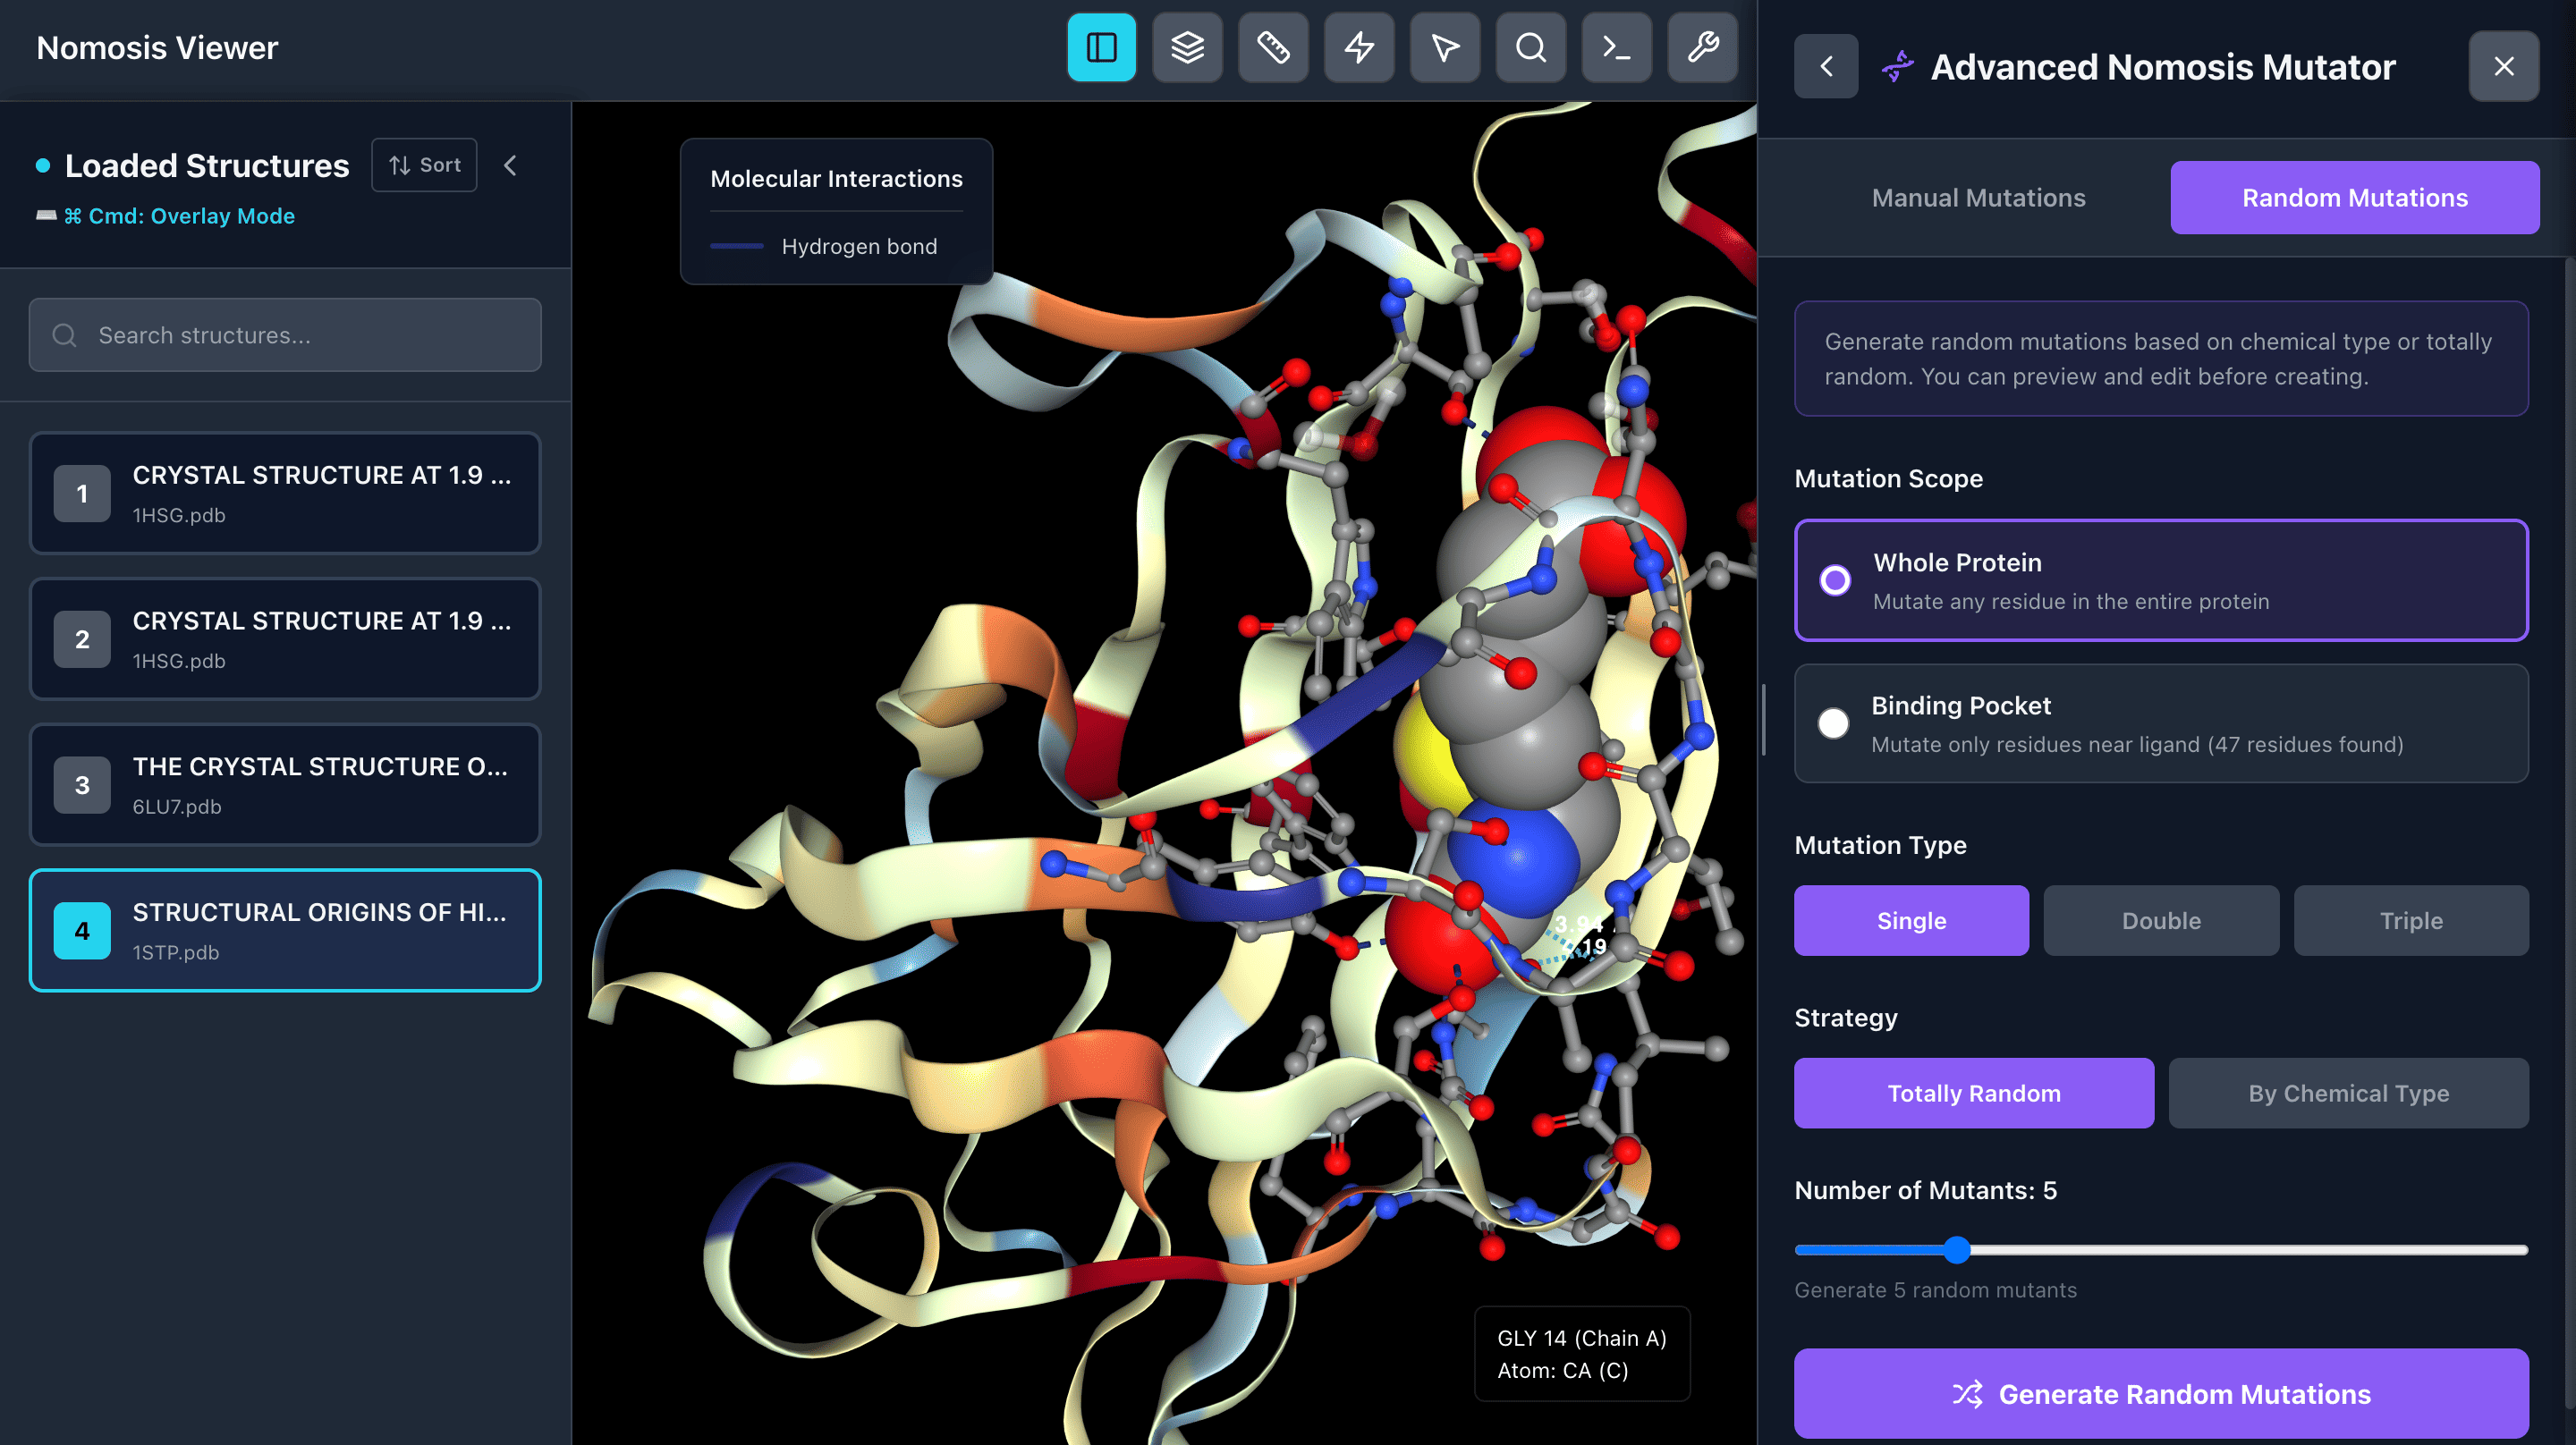
Mutant Generator
Generate mutants with chemically similar or random amino acid substitutions. Choose to mutate around the active site or throughout the entire protein. Create single, double, or triple mutants with sidechain clash minimization for realistic conformations.
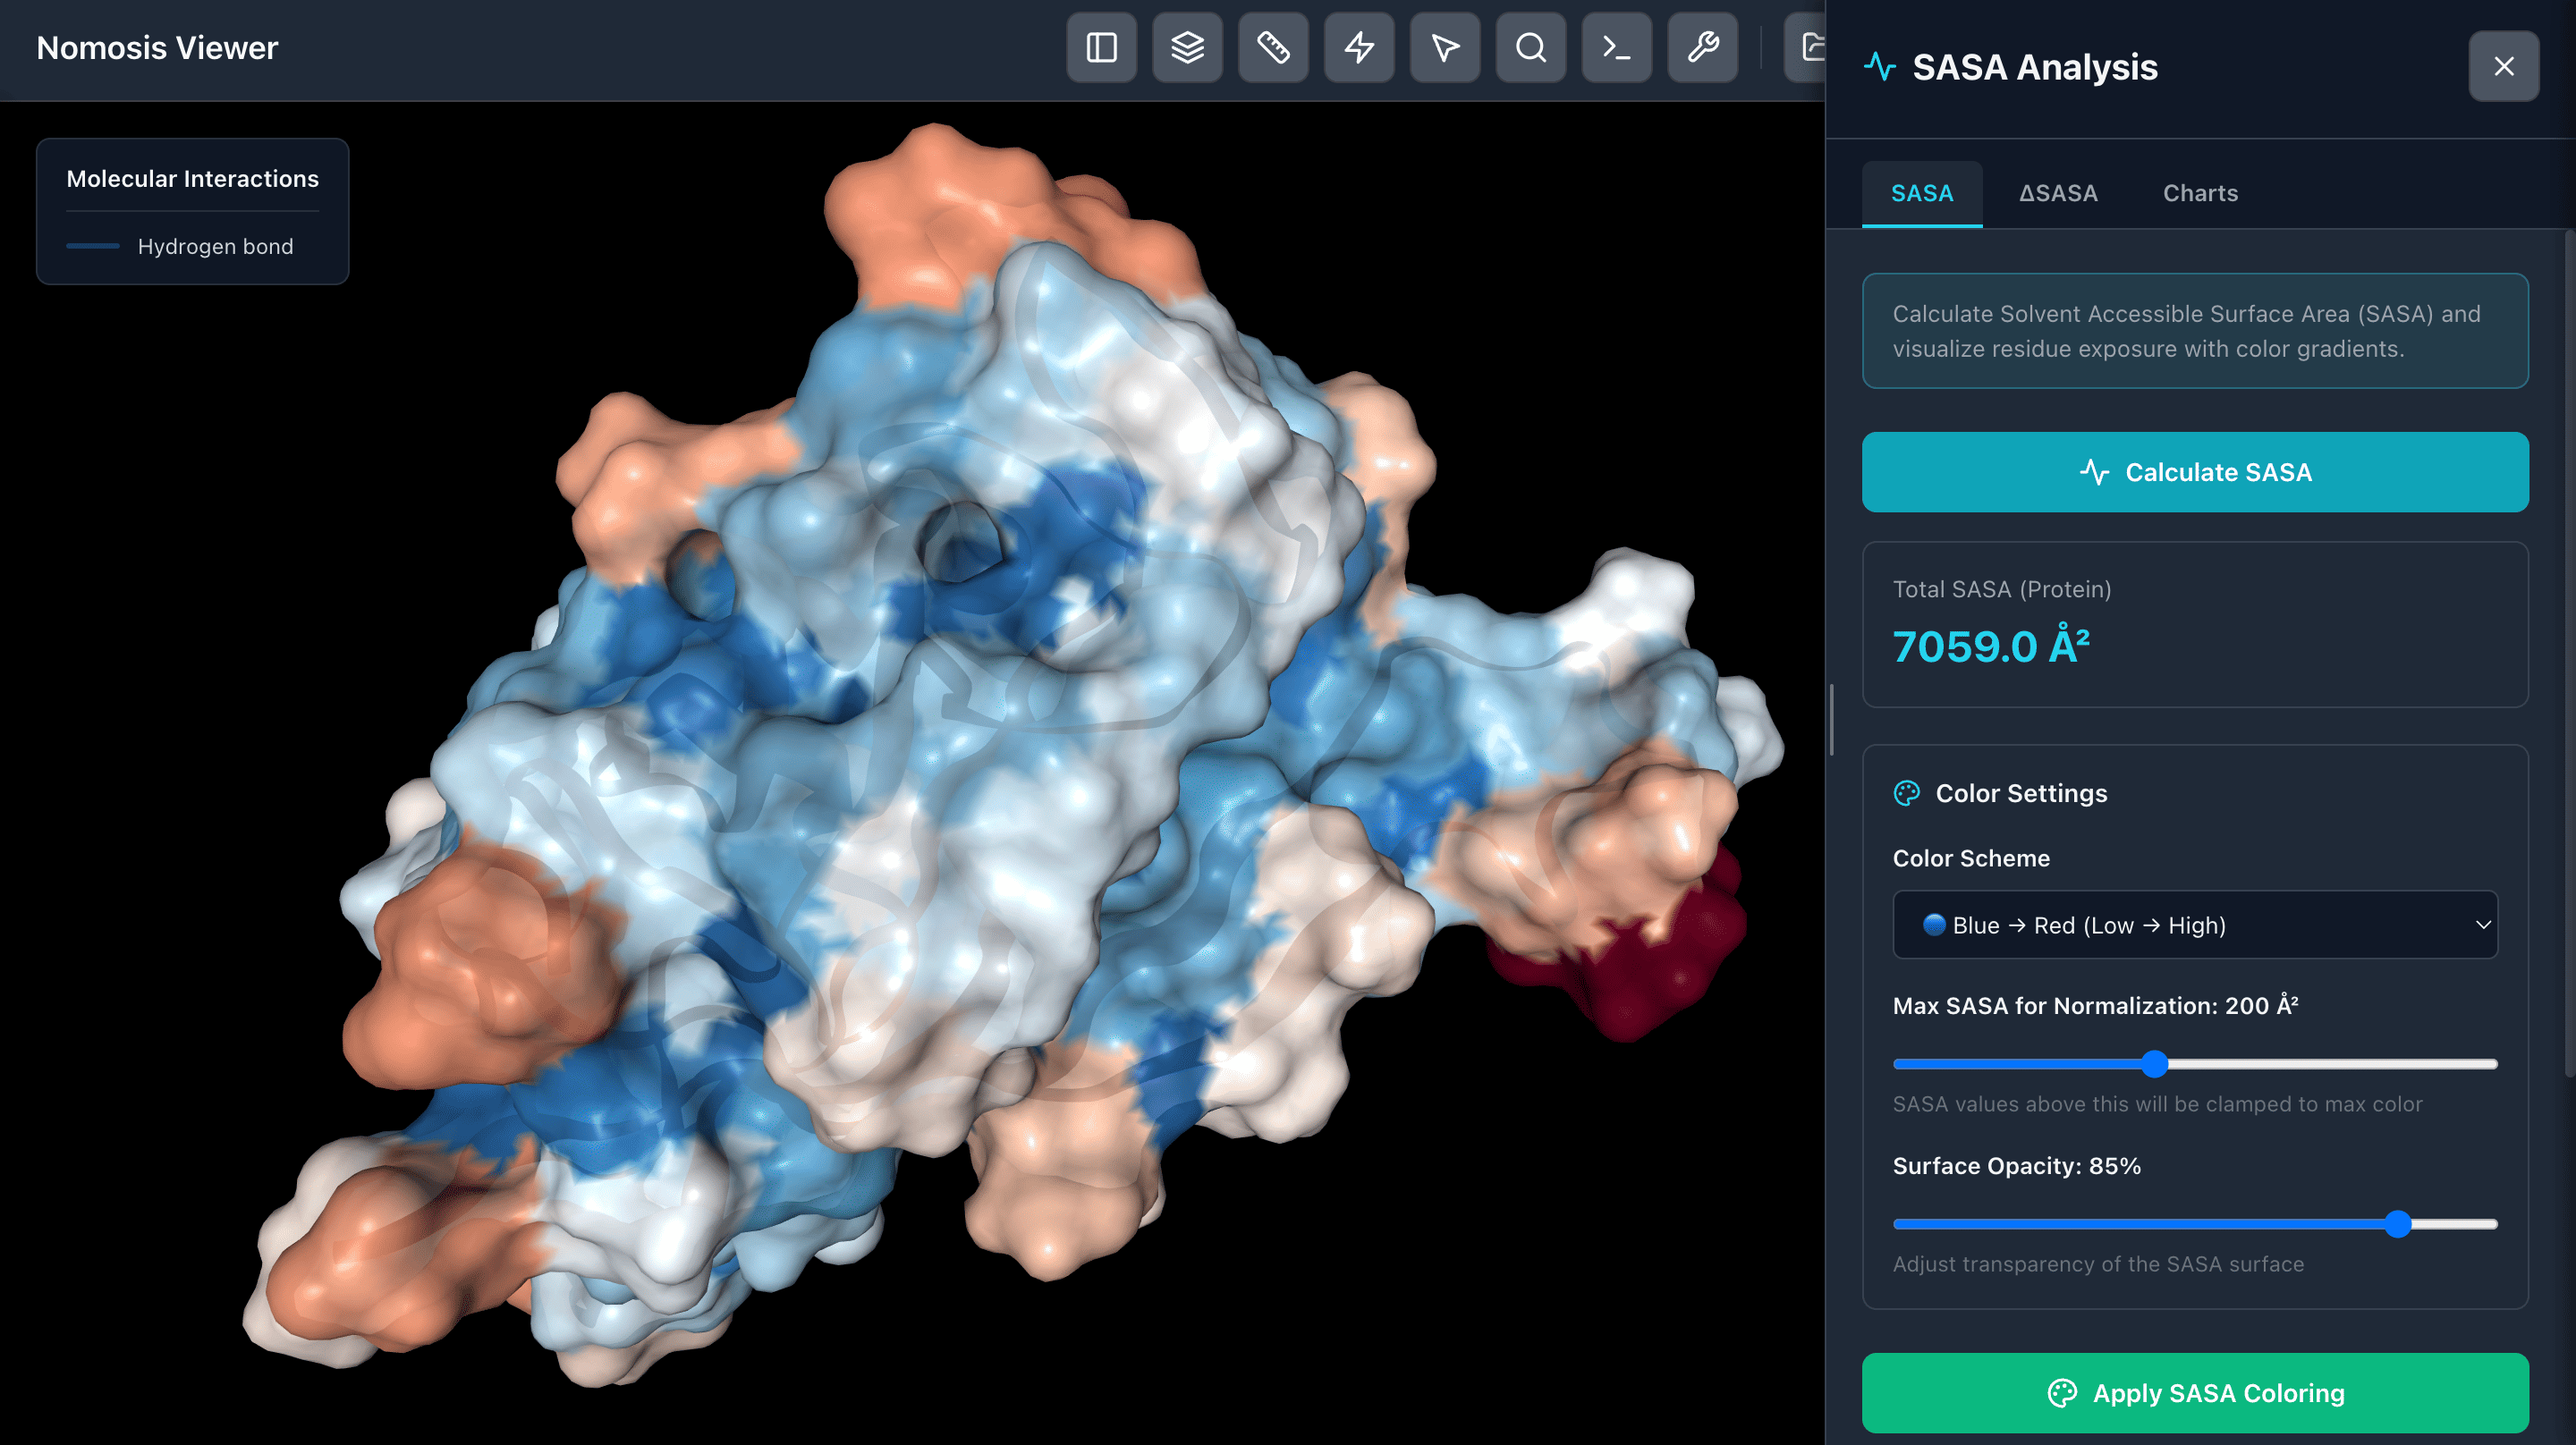
SASA Analysis
Analyze Solvent Accessible Surface Area (SASA) and visualize regions with color-coded surfaces based on accessibility. Identify buried and exposed regions to understand protein surface properties and potential binding sites.
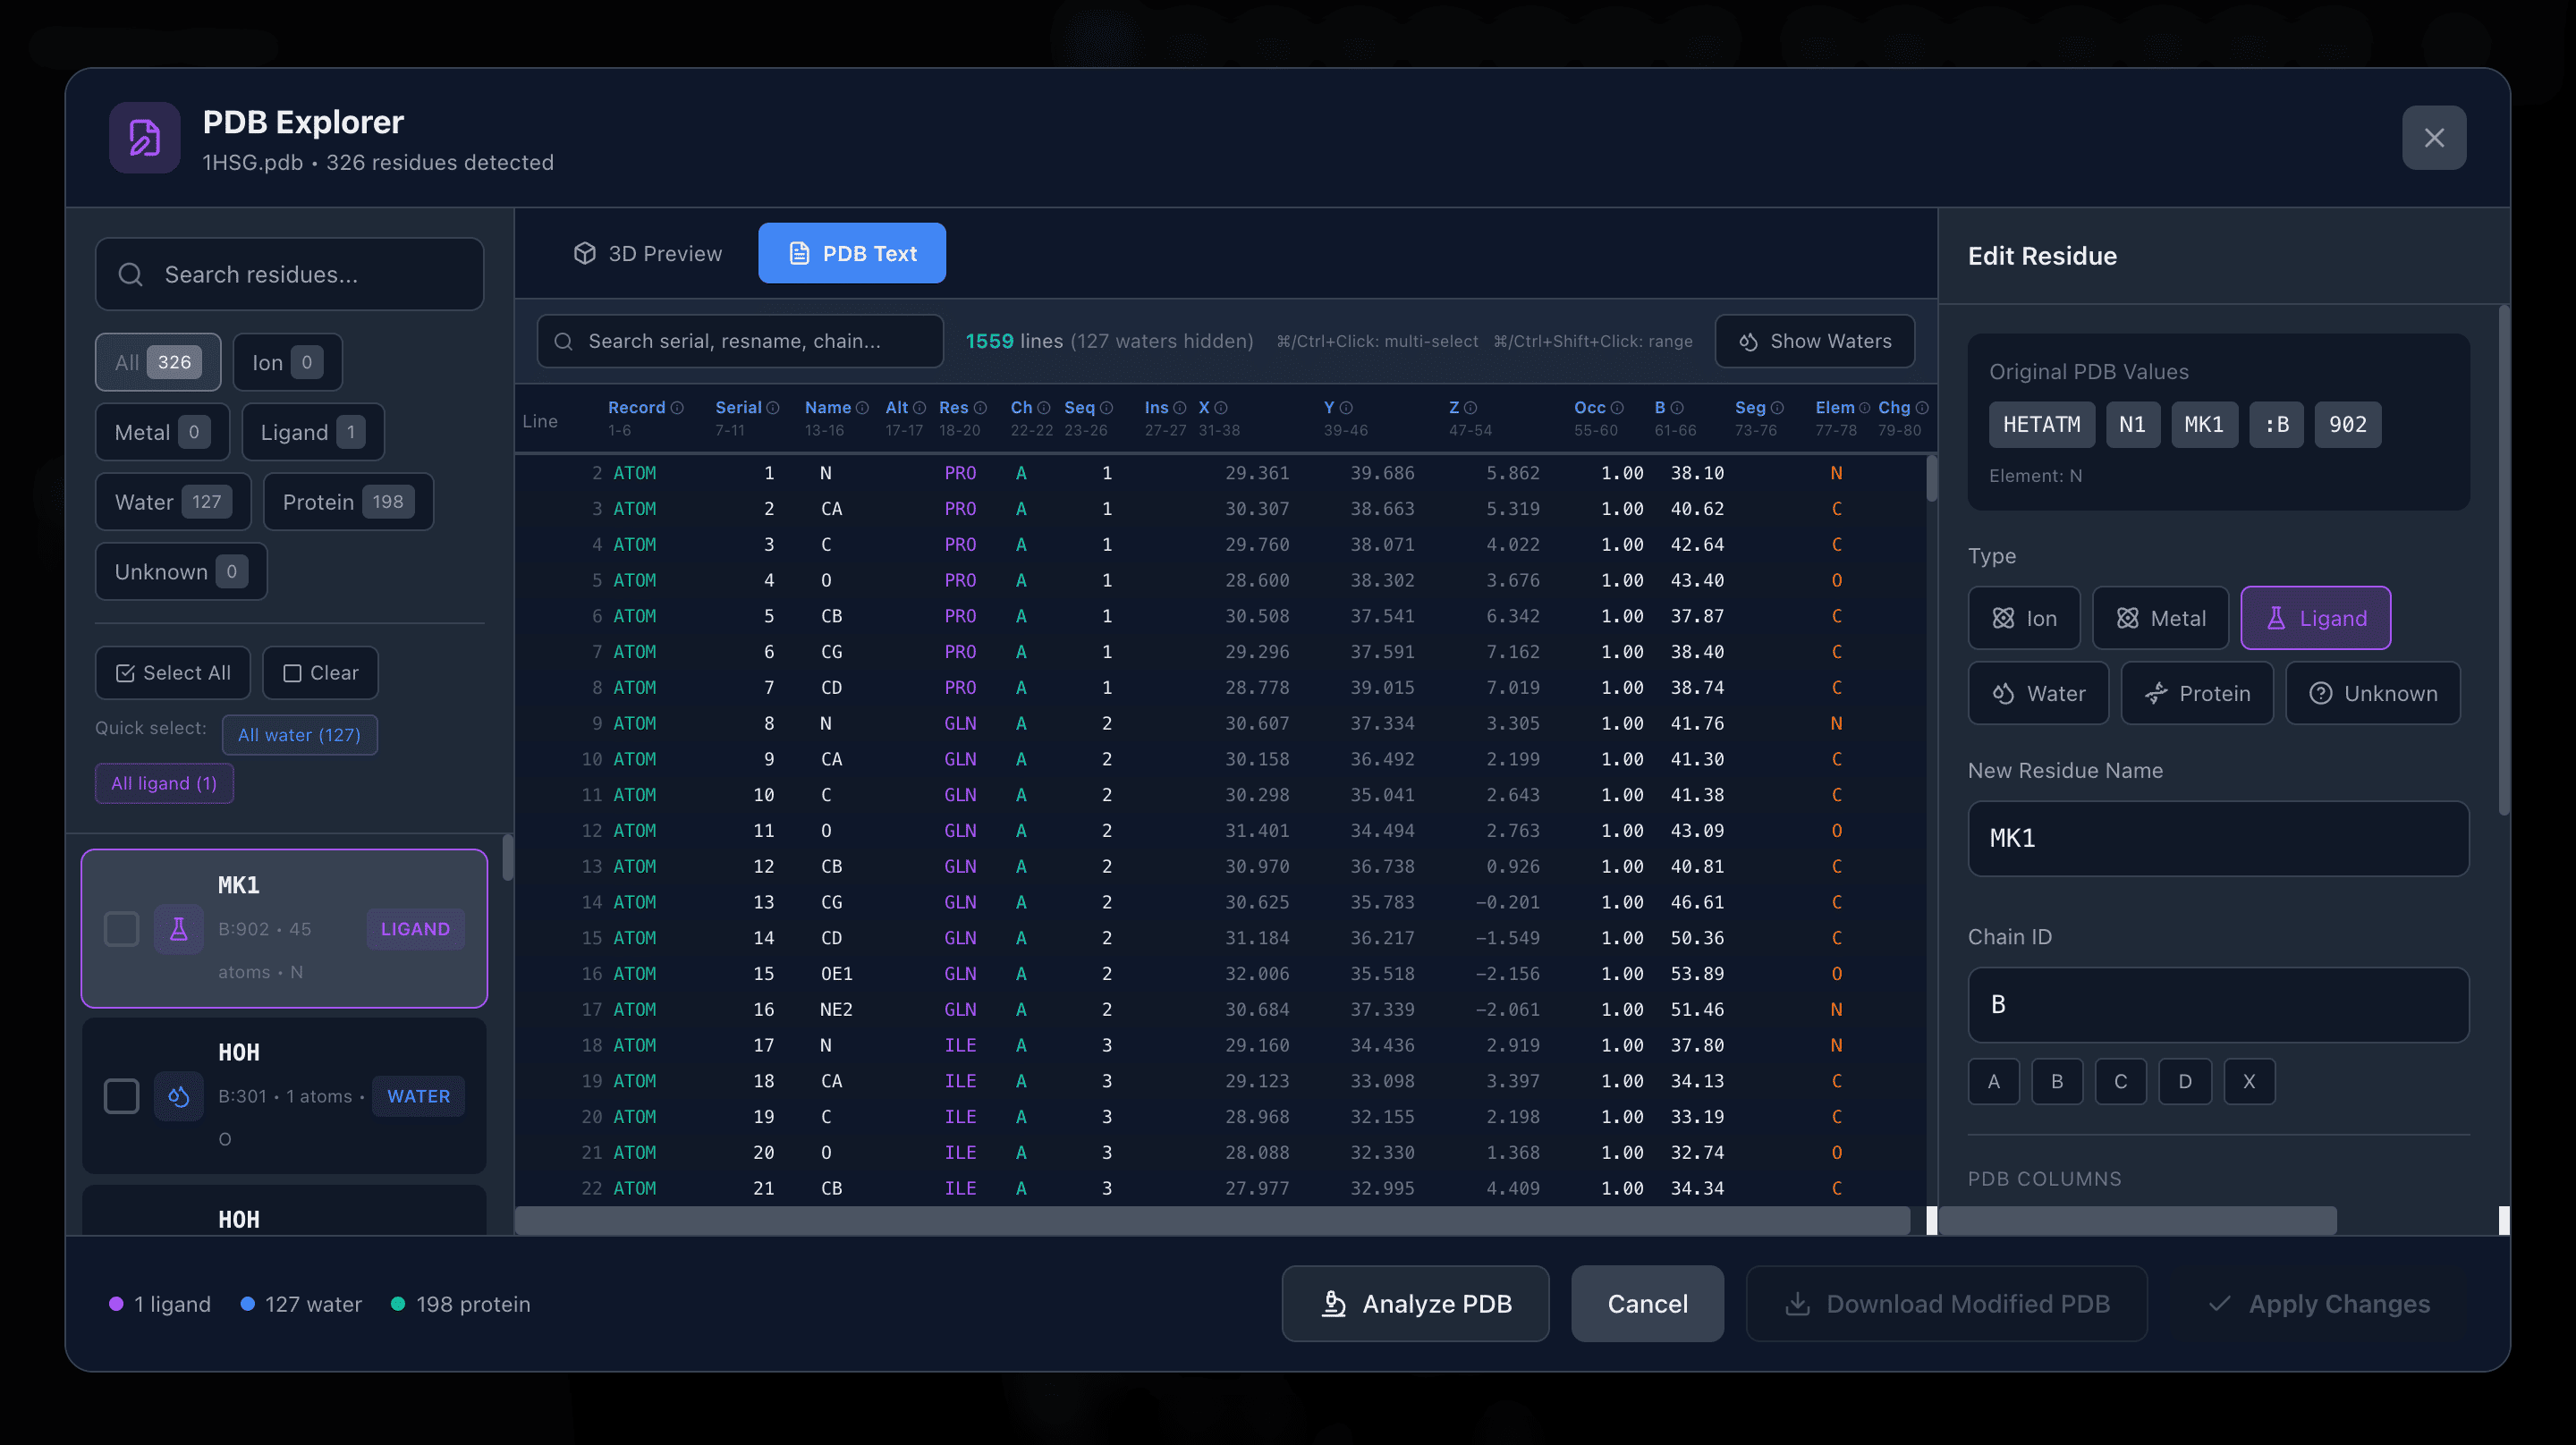
PDB Explorer
Explore your PDB files, analyze structural issues, and correct them as needed. Modify atom naming conventions, fix missing residues, and ensure proper formatting for downstream analysis and visualization.
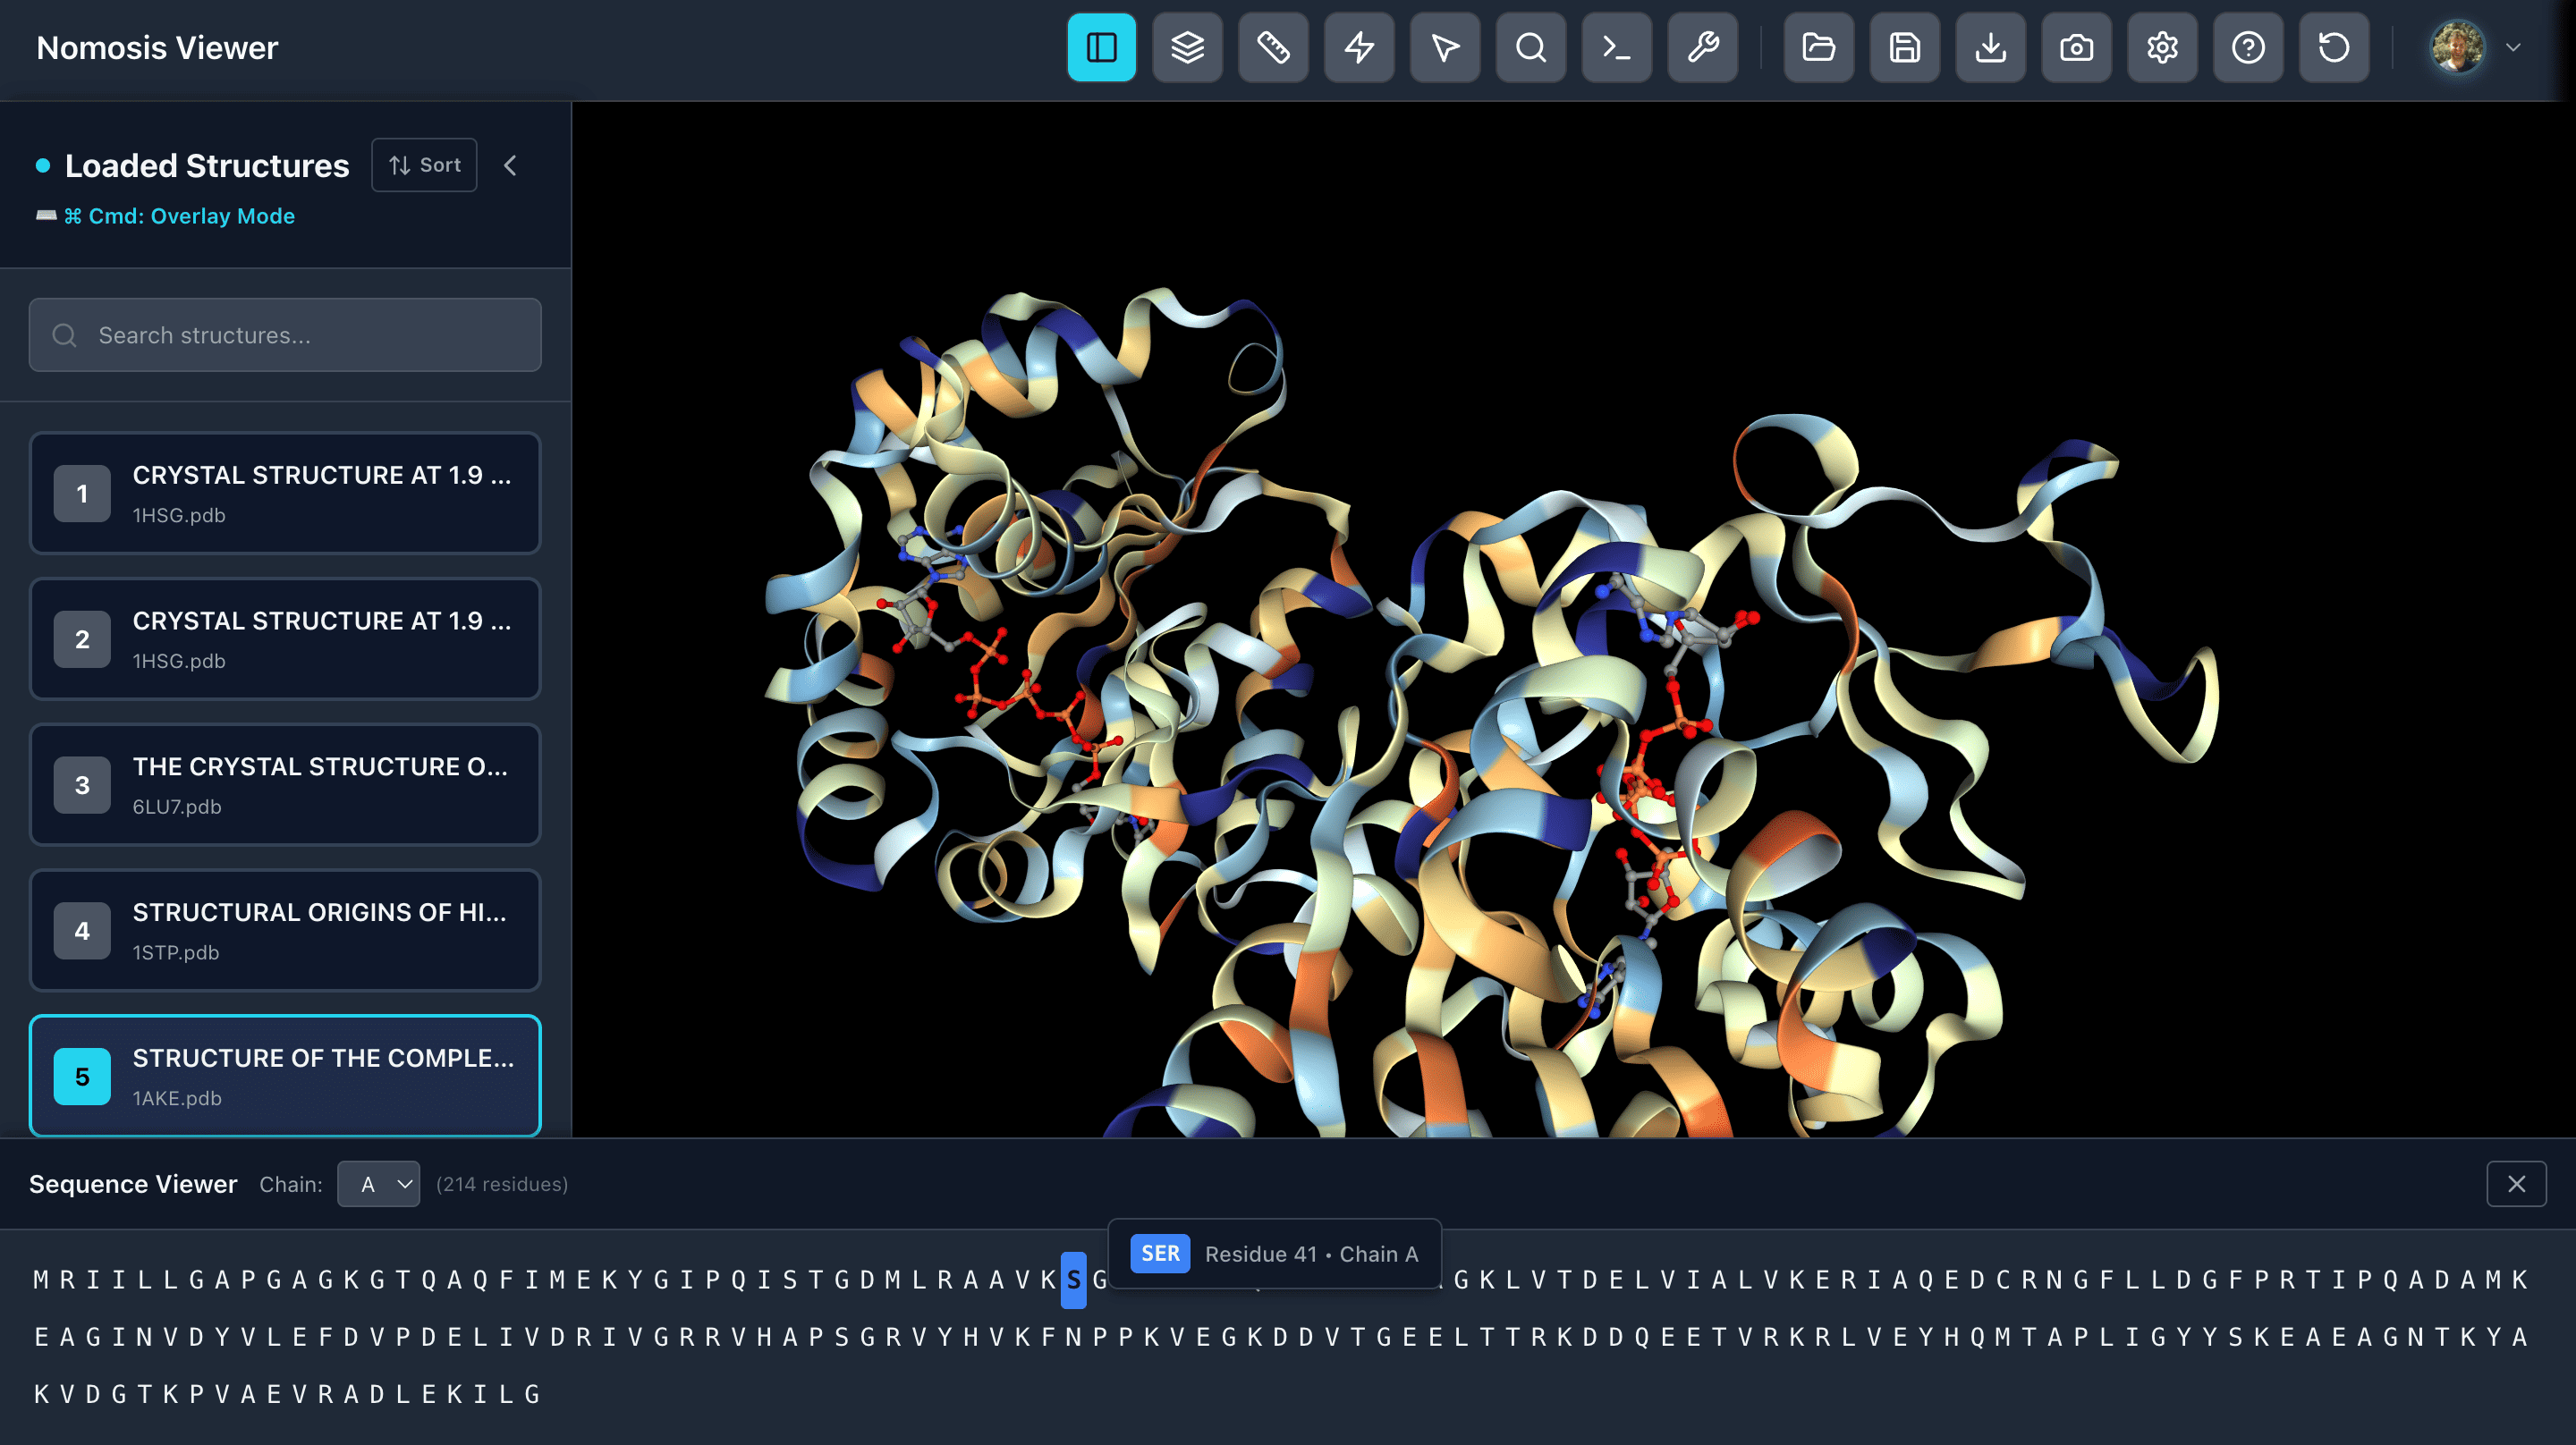
Sequence Viewer
View the amino acid sequence of your proteins and select specific chains. Click on any amino acid to zoom in and focus on that position in the 3D structure, enabling rapid navigation between sequence and structure.
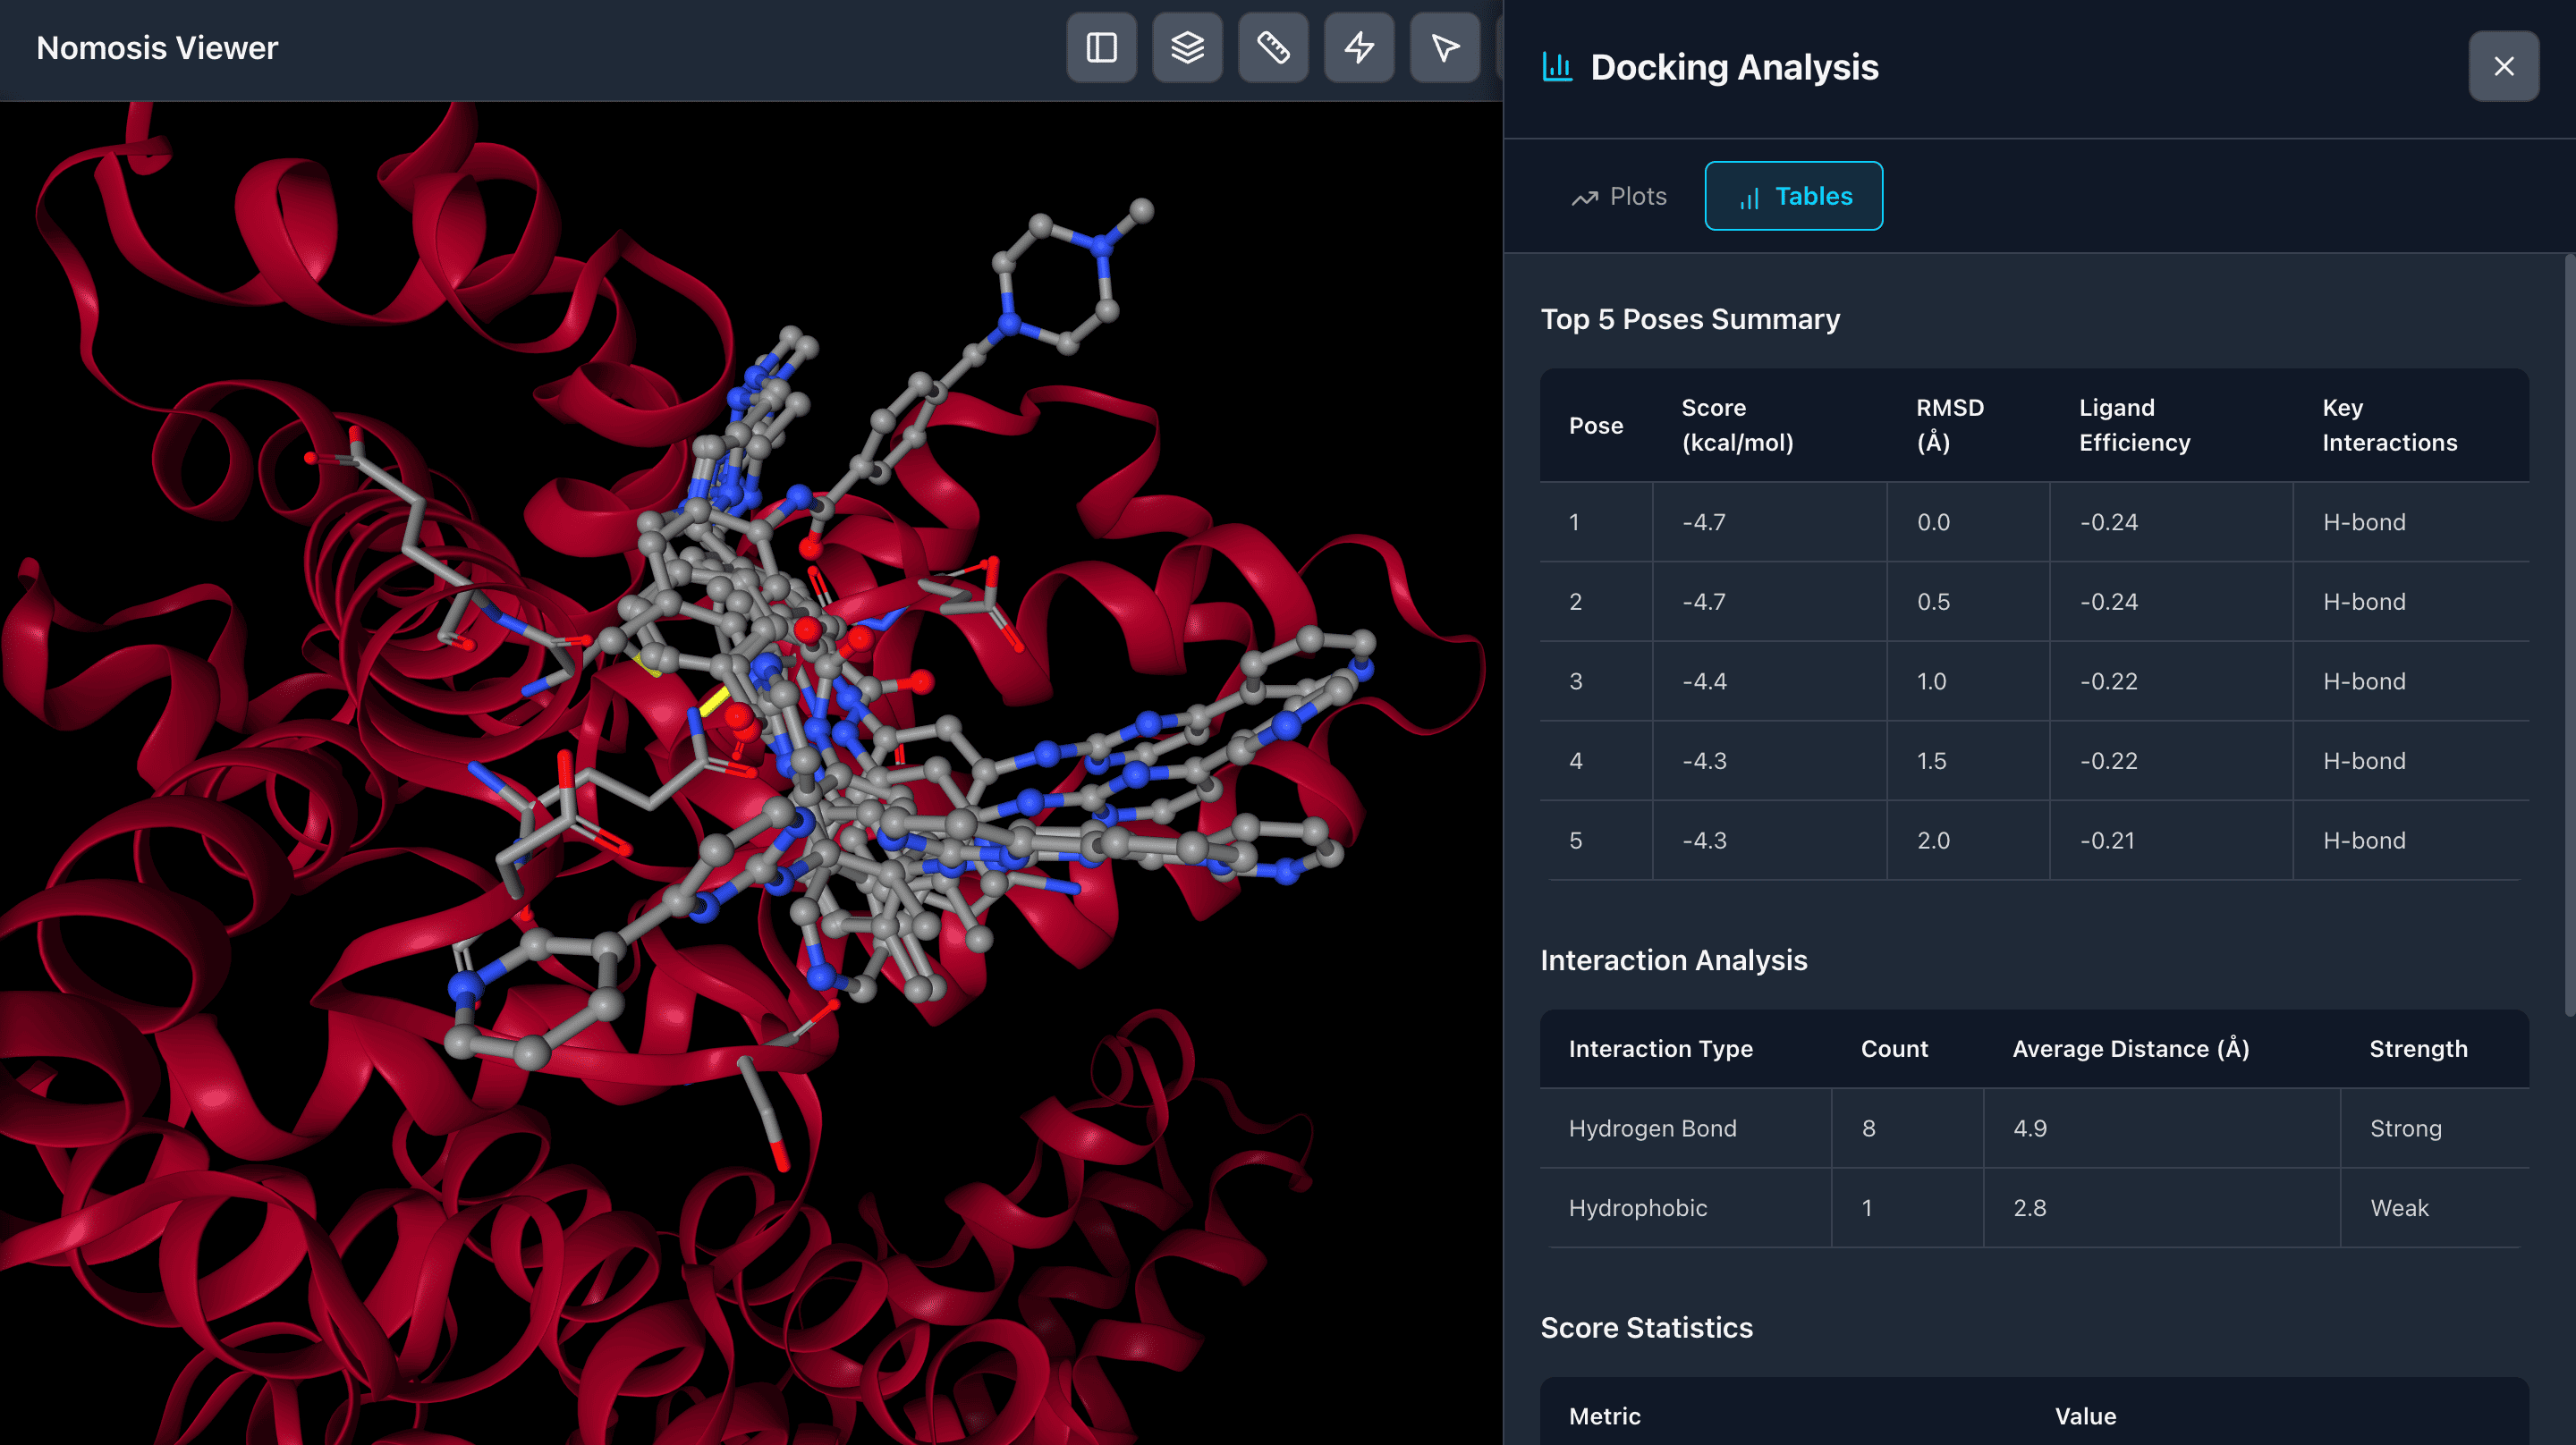
Docking Results
View docking results in comprehensive tables displaying scoring functions and binding metrics. Analyze and compare multiple poses, filter by score, and identify the most promising binding conformations for further investigation.
Ready to analyze molecular poses?
Start exploring protein-ligand interactions and docking results with powerful visualization and analysis tools.
Cookie Preferences
We use cookies to enhance your experience
We use cookies to analyze website traffic, personalize content, and improve your experience. You can customize your preferences or accept all cookies.